Land for Sale | Ball Rd, Ecru Mississippi
Land for Sale | Ball Rd, Ecru Mississippi Read More »
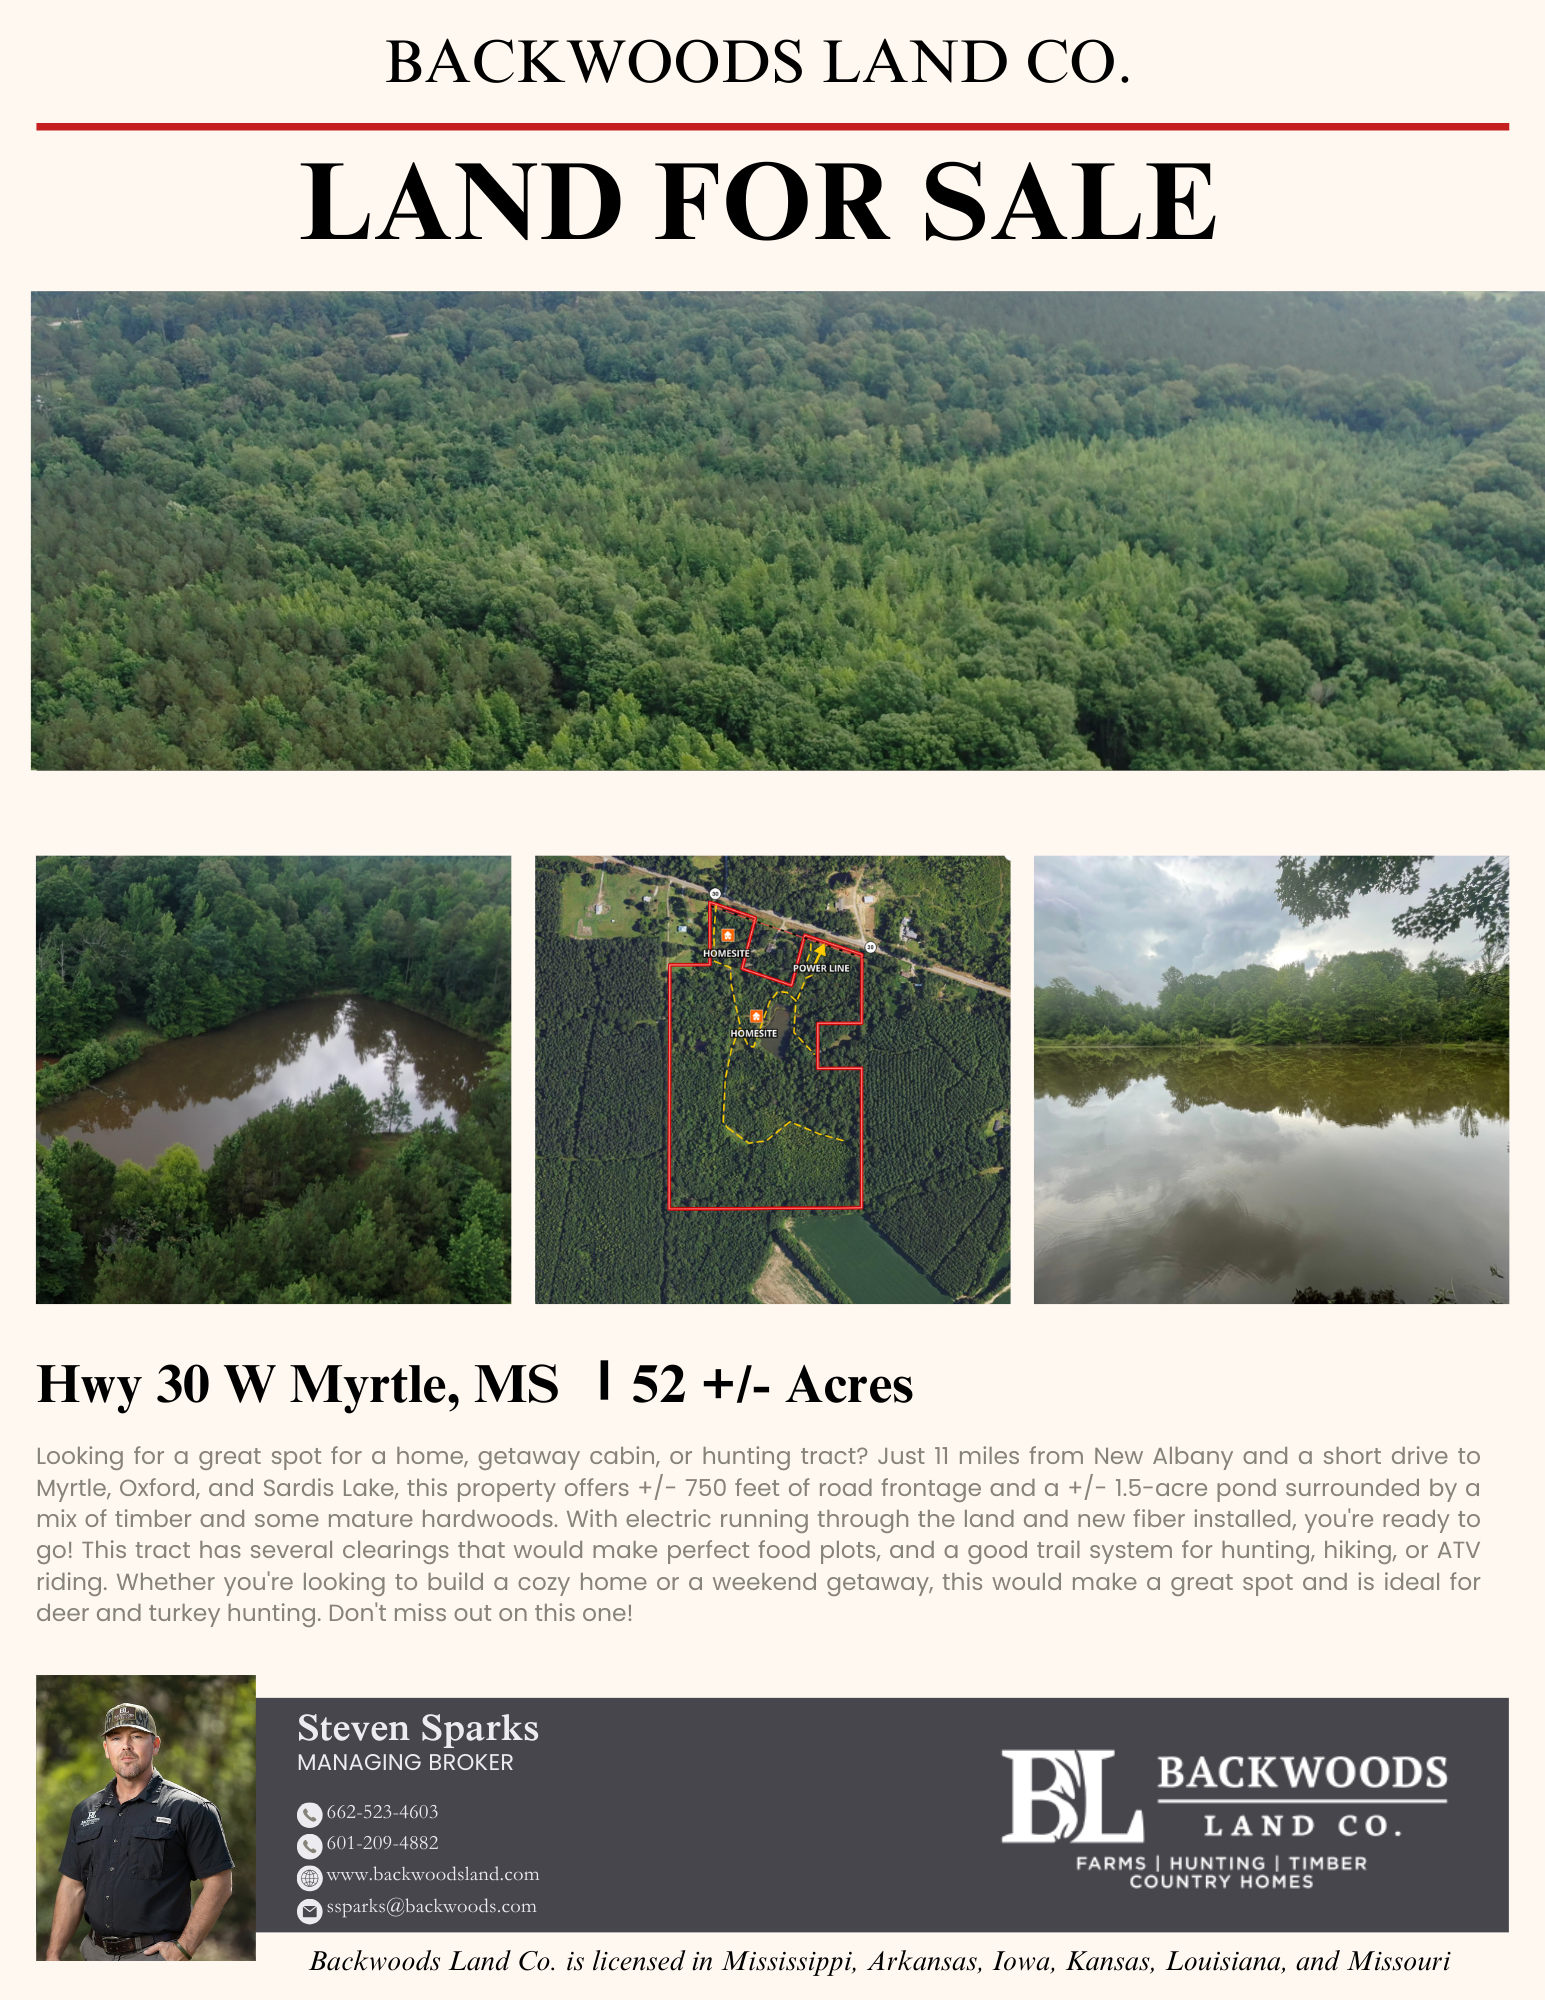
Steven Sparks | Backwoods Land Company
B3 and B2: These areas have a significant proportion of Ag-Mixed Timber properties (40% of total properties) and a lower but notable presence of Merchantable Pines.
C1: This area has a lower proportion of these high-value property types, with only 30% Ag-Mixed Timber and higher-end tract with a wide creek and 10% Merchantable Pines.
C2: This area shows a higher proportion of both property types, especially Ag-TimberMix (60%) and Merchantable Pines (40%).

This chart depicts a broader variety of land types and their respective proportions. The largest segments are “Mixed Timber” (21.4%) and “Ag-Mixed Timber” (17.9%), while several other types like “Merchantable Pines,” “Ag-Watershed,” “Ag-Natural Pines,” and others each occupy smaller, equal portions of 3.6% or 10.7%.

The presence of high-value property types like Ag-TimberMix and Merchantable Pines positively influences the average price per acre in these areas.
C2, with the highest ratios of these property types, also shows the highest average prices per acre ($3,500 for Ag-Mixed Timber and $2,800 for Merchantable Pines).
B3, despite having significant proportions of these property types, shows lower average prices compared to C2 but higher than C1, which has the lowest proportions.
A2, A3, B1: These areas have significant proportions of Ag-TimberMix and Merchantable Pines, which influences their higher land values.
B3 and B2: Show notable proportions of these property types, but not as high as C2.
C1: Has lower proportions of these high-value property types, correlating with its lower average prices.
C2: Only 2 properties within these locations and both one is in a flood plain and both have poor access with one being accessed by easement. This was the lowest land class price per acre of $1,600. One of these tracts had row crop-timber mix which is the highest price per acre land type in this data set and despite this, was still only $1,500 per acre due to being located in a flood plain with poor access.
Areas with higher proportions of Merchantable Pines and Ag-TimberMix generally have higher average prices per acre.
Area A2: Generally sells within 30-40 days
Area B3: Takes around 50-60 days to sell
Area C1: Longer market duration, around 70-80 days
Analyzing how quickly different property types sell:
Residential Development: Sells within 30-40 days
Cutover Land: Takes around 60-70 days to sell
Specifically for cutover properties:
Cutover Land: Consistently takes 60-70 days to sell
Analyzing the market duration for floodplain properties:
Floodplain Properties: Generally took 80-90 days to sell
Land prices vary widely across different areas. Here’s a breakdown of the average prices per acre:
Area A2: $3,800 per acre
Area B3: $3,600 per acre
Area C1: $2,000 per acre
Understanding the impact of floodplain status on land value:
Non-Floodplain: $3,200 per acre
Floodplain: $2,400 per acre
Analyzing land prices based on market status:
Active Listings: $3,200 per acre
Closed Sales: $2,800 per acre
A-1 – B1 properties have a higher disparity compared to tracts in less desirable locations.
Active Listings: $3,500 per acre
Closed Sales: $2,800 per acre
B-2 – C-2 Tracts
Active Listings: $2,000 per acre
Closed Sales: $1,600 per acre
To understand market trends a little better, we compare the contract price and sold price for closed sales:
B-3 through C-3:
These areas generally have a mix of land types but often show significant proportions of less developed or less agriculturally productive lands.
Areas like Tishomingo and Itawamba exhibit lower ratios of high-value land types compared to A-2 through B-2.
A-2 through B-2:
These areas often feature better topography suitable for agriculture, such as Ag-Mixed Timber properties and other high-value land types.
Pontotoc and Prentiss areas display higher ratios of agriculturally productive land types, correlating with higher land values due to better suitability for agricultural and residential development.
Better Topography in A-2 through B-2: These areas are more likely to have better topography, making them more suitable for agriculture and residential development. This suitability is reflected in higher average prices per acre.
Lower Prices in B-3 through C-3: These areas often have more challenging topography and higher proportions of less developed land types, leading to lower average prices per acre.
North MS Quarterly Land Analysis Read More »

Land for sale on New Temple Rd, Golden, Mississippi! This 67-acre tract offers impressive road frontage and is just a mile away from the new Hwy 76, connecting you to Tupelo, Decatur, and Huntsville. This prime piece of land in Golden, MS is perfect for building your dream home, featuring a picturesque pasture area with utilities available and newly installed fiber optic lines, providing stunning views of the rolling hills.
This land for sale on New Temple Rd, Golden, Mississippi, is ideally located just a mile from the new Hwy 76, providing easy access to Tupelo, Decatur, and Huntsville.
This property in Golden, Mississippi offers a perfect spot to build your dream home. With a pasture area equipped with utilities and new fiber optic lines, the land for sale on New Temple Rd provides beautiful views of the rolling hills in the distance.
With significant road frontage, this land for sale in Golden, Mississippi, on New Temple Rd is easily accessible and visible, making it an excellent investment or home-building site.
Included on the property is a spacious +/- 2170 square foot barn, complete with electricity. This feature enhances the value of this land for sale on New Temple Rd, Golden, Mississippi.
Towards the west side of the tract, you’ll find mature pines and a trail for hunting, ATV riding, or camping, along with a pond for fishing. This makes the land for sale on New Temple Rd in Golden, Mississippi, perfect for outdoor enthusiasts.
The north side of this land for sale on New Temple Rd, Golden, Mississippi, features a flowing year-round creek, an acre-plus food plot, and a box blind shooting house, making it turn-key for turkey and deer hunting.
This land for sale in Golden, Mississippi, offers a little bit of everything for outdoor enthusiasts, from hunting and fishing to riding trails and camping.
Land for Sale | New Temple Rd, Golden Mississippi Read More »
 From Quiet Corner to Market Square: Maximizing Your Land Sale Potential
Consider your land as an item on a store display. Opting for sale by owner is akin to setting up a small stall in a quiet corner – you might get a couple of interested passersby, but your reach is limited. However, with a land agent or broker, it’s like having a bustling market square at your disposal. We utilize our networks, targeted marketing, and industry connections to create a buzz around your land, attracting a wide range of potential buyers. How do you know what it’s really worth unless it’s exposed to the maximum amount of potential buyers?
Many will say, a thing is worth what someone will pay for it and that sounds reasonable – on the surface. But market value goes beyond a single offer or 2 or 3 if the property isn’t exposed to the market. Generally, market value is defined as the most probable price that a property should bring in a competitive and open market under all conditions requisite to a fair sale, the buyer and seller, each acting prudently, knowledgeably and assuming the price is not affected by undue stimulus. One caveat is that a reasonable time is allowed for exposure in the open market. “Exposure in the open market” being key here.
For Sale by Owner Listings Often Leave Money on the Table
While an FSBO listing might technically meet the “reasonable time” requirement, the limited reach often translates to a smaller pool of buyers. This can lead to a final sale price that falls short of true market value. A land broker, on the other hand, can significantly increase your exposure through various channels, attracting a much wider group of buyers who are actively seeking land including local and out of state buyers. This open market competition is what truly reveals the market value of your land, ensuring you get the best possible price. Maximizing exposure can help create competition among buyers, ultimately maximizing the sale price of your land.
Therefore, working with a professional such as Backwoods Land Company who can facilitate broad exposure in the open market is by far the best way to achieve the true market value of your property. By partnering with us, you can rest assured that your land is seen by the right buyers, leading to a competitive bidding process that delivers the best possible outcome.
Don’t Settle for Less | Importance of Land Sale Exposure Read More »
Picture this: a long time ago in Germany, there was a farmer and economist named Johann Heinrich Von Thünen. He lived in a time when farming was rapidly. People were moving away from old-style farming and starting to sell their products in markets. Von Thünen was curious about how farmers could make the most money by using their land wisely.
Von Thünen’s model, developed by the German economist Johann Heinrich von Thünen in the early 19th century, is a seminal concept in the field of agricultural and land use economics. While originally designed to explain agricultural land use patterns, this model has found applications in various disciplines, including real estate appraisal. This article explores how Von Thünen’s model can be useful in the context of real estate appraisal and other modern analysis concepts of land use.
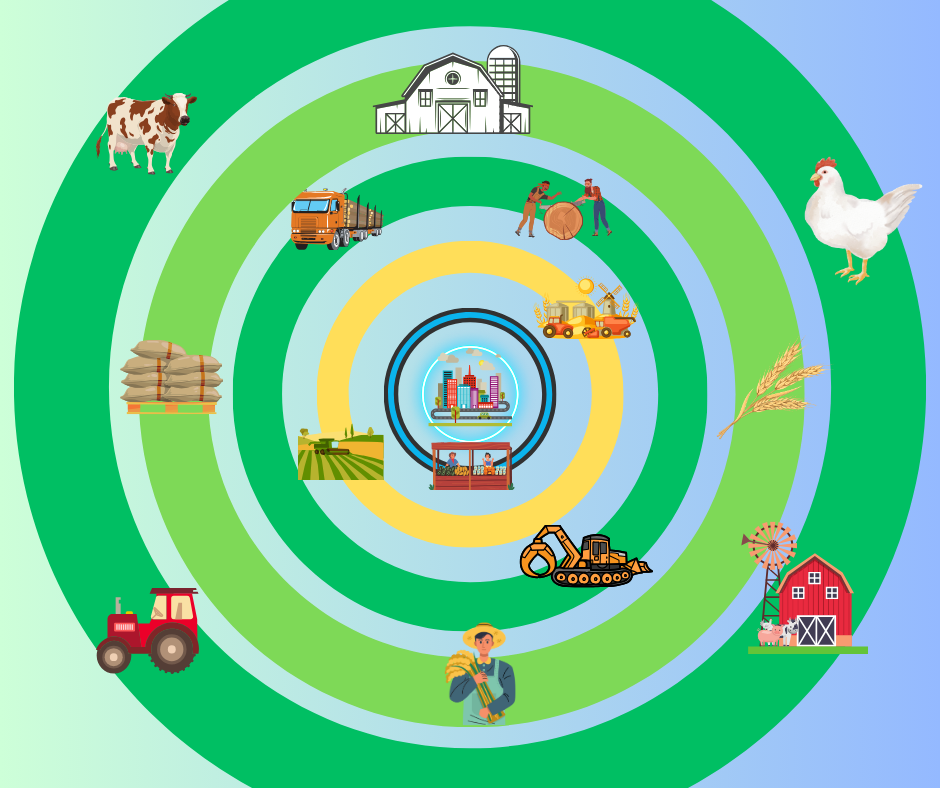
Von Thünen’s model revolves around the concept of land use and spatial distribution based on transportation costs. The central premise is that land use decisions are primarily influenced by proximity to markets and the cost of transportation. In his model, Von Thünen envisioned a hypothetical isolated city surrounded by a circular region of agricultural land, where different types of crops and land uses are arranged concentrically based on transportation costs.
The Isolated City
Von Thünen’s model starts with the assumption of a central city or market, which serves as the focal point for economic activity.
Land uses are organized in concentric rings around the central city. The specific type of crop or land use in each ring is determined by the cost of transportation to the city. The most profitable crops or land uses are located closest to the city, while less profitable ones are placed farther away. Think of this place as having rings around the city, like the rings on a bullseye. Each ring is for different types of farming, like growing crops or raising animals.
Transportation Costs Transportation costs increase with distance from the city. This cost gradient is crucial in determining which crops or land uses are economically viable at different distances from the city. If you’re close to the city, it’s easier to sell your stuff, so you might grow things that need more care. But if you’re far away, you might grow things that don’t need as much attention.
Real estate appraisal involves determining the value of a property based on various factors, including its location, land use, and market demand. Von Thünen’s model can be applied to real estate appraisal in several ways:
Von Thünen’s model provides a framework for understanding how proximity to a central market affects property values. Real estate appraisers can use this concept to assess the desirability of a location and its potential for future development. Properties are historically located closer to major economic centers are often more valuable due to easier access to services and markets. However, Over the years, urban areas have experienced exponential population growth, leading to urban sprawl and the expansion of metropolitan regions. As cities expand outward, the dynamics of location desirability become more complex. Peripheral areas, once considered less valuable due to their distance from the central market, may now gain prominence as urban boundaries expand. This expansion, driven by factors like housing demand and infrastructure development, challenges the traditional application of Von Thünen’s model.
Another critical factor reshaping location analysis is the prevalence of crime and safety concerns. In many cases, areas closer to central markets have experienced higher crime rates, prompting potential residents and businesses to seek safer, albeit more distant, alternatives. This shift can lead to a reevaluation of property values, with safety considerations outweighing proximity to the central market
Real estate appraisers can consider the historical and predicted land use patterns in an area based on Von Thünen’s model. This can help in evaluating the potential demand for various types of properties. For example, if a region is transitioning from agriculture to residential development, understanding this shift can inform property appraisals.
The cost of transportation plays a critical role in property values. Proximity to highways, public transportation, and other infrastructure can significantly impact property appraisals. Von Thünen’s model underscores the importance of considering transportation costs when appraising real estate.
Real estate appraisers can analyze the accessibility of properties to different markets using the Von Thünen framework. This analysis can help in estimating the potential rental or sale value of a property, as properties closer to lucrative markets tend to command higher prices keeping shifting demands in mind.
In rural areas, the model can be used to assess the value of agricultural land based on its proximity to markets and the type of crops or land use in practice. This can guide decisions related to land purchase, leasing, or conversion.
Geographic Information Systems (GIS) technology is a powerful tool for real estate analysis, allowing professionals to integrate spatial data into their decision-making processes. Von Thünen’s model can be applied within a GIS framework to assess real estate values and land use patterns. Here’s an example of how to use this model for GIS-based real estate analysis:
Scenario: Imagine you are a real estate developer interested in acquiring land for a new residential project in a suburban area near a major city. You want to use GIS to determine the most suitable location for your development based on Von Thünen’s model.
Step 1: Data Collection
Market Data: Obtain data on the central city’s economic activities, employment centers, and population growth projections. This can be collected from government sources, economic development agencies, and census data.
Transportation Infrastructure: Gather GIS data on existing transportation infrastructure, including highways, major roads, public transit routes, and airports. You can access this data from local transportation departments or open data sources.
Land Use Data: Acquire land use data for the study area. This data should include information on existing residential, commercial, agricultural, and industrial land uses.
Step 2: GIS Analysis
Market Proximity: Use GIS to create a buffer zone around the central city, with varying distances representing the zones in Von Thünen’s model. For example, you might have concentric buffers at 5 miles, 10 miles, 15 miles, and so on.
Transportation Costs: Calculate transportation costs or travel times from each point within these buffer zones to the central city using GIS network analysis tools. Consider factors like road quality, traffic congestion, and public transit availability in your cost calculations.
Land Use Overlay: Overlay the land use data onto the buffer zones. This will help you determine the predominant land use types within each zone.
Step 3: Analysis and Decision-Making
Market Demand: Analyze the market data to understand the current and future demand for residential properties in the central city and its surrounding areas.
Transportation Costs: Assess the transportation costs or travel times for each buffer zone. Consider the model’s principle that transportation costs increase with distance from the central city.
Land Use Suitability: Evaluate the suitability of land use within each buffer zone based on the model’s principles. For instance, if the model suggests that agriculture is more viable in the outer zones, but market demand is for residential properties, you may prioritize zones with a mix of agriculture and residential land.
Value Assessment: Combine the information on market demand, transportation costs, and land use suitability to estimate the potential value of properties within each buffer zone. Properties that align with market demand and have reasonable transportation costs are likely to be more valuable.
Location Selection: Based on the analysis, identify the buffer zone that offers the best balance between market demand, transportation costs, and land use suitability. This zone is likely to be the most suitable location for your residential development project.
By applying Von Thünen’s model within a GIS framework, you can make data-driven decisions in real estate development. GIS allows you to visualize and analyze complex spatial relationships, helping you identify the optimal location for your project while considering market dynamics and transportation factors.
Johann Heinrich von Thünen’s model, developed in the early 19th century, provided valuable insights into agricultural land use patterns based on transportation costs and proximity to urban centers. While his model remains relevant for understanding certain aspects of rural development, the world has undergone significant changes since his time. Here are some key ways in which outlying rural development has evolved since Von Thünen’s model was first introduced:
One of the most significant changes is the advent of modern transportation and communication technologies. The widespread availability of automobiles, improved road networks, and the rise of the internet have reduced the relative importance of transportation costs in land use decisions. As a result, rural areas are no longer as constrained by distance from urban centers, and economic activities can be more dispersed.
The continued trend of urbanization and suburbanization has reshaped the rural landscape. Many rural areas have experienced population decline as people migrate to urban and suburban areas in search of better economic opportunities and amenities. This has led to changes in land use, with some rural regions becoming more residential or recreational in nature.
Rural economies have diversified beyond traditional agriculture. While agriculture remains important, rural areas now host a variety of industries, including manufacturing, technology, tourism, and renewable energy production. These new economic activities have transformed the rural development landscape, with different land use patterns emerging.
Environmental and conservation concerns have led to changes in land use practices in rural areas. Government regulations and incentives often encourage the preservation of open space, the protection of natural habitats, and sustainable land management. This has influenced the way rural land is used and developed.
Some rural areas have transitioned to amenity-based development, attracting residents and businesses due to their natural beauty, recreational opportunities, and quality of life. This form of development is less tied to traditional agricultural or industrial land use patterns and is driven by lifestyle choices.
Globalization has increased the interconnectedness of rural areas with the broader world economy. Rural regions now participate in global supply chains, leading to changes in land use to accommodate export-oriented agriculture and manufacturing.
Public and private investments in rural infrastructure, such as airports, railroads, and broadband internet, have opened up new possibilities for rural development. These investments have improved connectivity and accessibility, reducing the isolation often associated with outlying rural areas.
Changes in demographics, with an aging population and an influx of younger generations with different preferences and lifestyles, have influenced rural development. These shifts have led to changes in housing preferences and the demand for services in rural areas.
I have firsthand experience with Geographic Information Systems (GIS) and have noted similar patterns to Von Thünen’s model. However, the global landscape is evolving at an unprecedented pace, and although this model remains effective, it is continually adapting to the ever-changing dynamics of our world.
While Von Thünen’s model laid a foundational framework for understanding rural land use, the landscape of outlying rural development has evolved significantly since its conception. Modern factors like technological advancements, urbanization, economic diversification, environmental concerns, and globalization have all contributed to a more complex and diverse rural development pattern. These changes highlight the need for a more comprehensive and nuanced approach to understanding and planning for rural development in the 21st century.

Von Thünen’s Model – A Historical Lens on Modern Agriculture and Real Estate Analysis Read More »
 CRACKING THE RUT SEASON CODE | MASTERING RUT SEASON STRATEGIES
The rut hunting calendar isn’t just a list of dates; it’s a roadmap through the phases of the rut season. In this guide, we’ll look at these phases, from the initial stirrings of pre-rut to the second rut. Along the way, we’ll uncover effective tactics and strategies to up your hunting game during this exhilarating period.
Early-Season Transition: October 10-22
As we transition from the early season to mid-October, we enter the pre-rut phase. It’s important to note that the true early season extends until around October 10, with the pre-rut following closely. During this phase, deer undergo a transition from their early season habits to their fall ranges. Numerous factors, including changing environmental conditions and hunting pressure, contribute to these shifts.
Strategic Focus: Prioritize mature bucks, as their locations may change as the rut progresses.
The pre-rut phase witnesses increased deer activity, evident through the emergence of rubs and scrapes. Contrary to the misconception of an “October lull,” deer are on the move, just not necessarily in the same open areas. They shift to fall ranges, with a preference for food sources like acorns. For hunters, the game plan involves identifying buck bedding areas and positioning themselves between these areas and the preferred food source, such as acorns. Furthermore, evening hunts tend to yield better results during this phase than morning ones.
Seeking Phase: October 23 to November 1
The seeking phase unfolds, marked by more pronounced rut like behavior among bucks. This phase typically spans the last seven to ten days in October and sometimes stretches into early November. During this period, rut signs become more prominent, and testosterone levels rise, leading to increased daytime activity among bucks. While mature bucks might not actively chase does yet, they are more visible.
Strategic Focus: Employ calling and rattling techniques while continuing to emphasize bed to feed patterns.
Morning hunts become a viable option during the seeking phase. The focus remains on buck bedding areas, with rut signs such as scrapes and rub lines near these areas gaining significance. Positioning yourself between rut signs and buck bedding proves effective for morning hunts, while evening hunts still follow bed-to-feed patterns.
Chasing Phase: November 2-10
This is the phase commonly associated with the rut, even though actual breeding may not begin for a few more days. During the chasing phase, bucks, including mature ones, are observed chasing does. It’s a more aggressive phase that follows the seeking phase.
Strategic Focus: Implement aggressive calling and rattling tactics, and consider hunting in areas downwind of doe bedding spots and thick cover where deer might seek refuge.
To make the most of the chasing phase, set up along trails parallel to open areas and food sources, where bucks scent-check for does in estrus. In hilly terrain, concentrate on ridges just down from the crest. Aggressive calling, rattling, and decoying tactics are effective at this stage, as bucks’ testosterone levels peak.
Tending Phase: November 11-20
The tending phase, also known as the lock-down phase, is when most does are bred, and bucks stay with them in dense cover. While hunting during this phase can be challenging, it’s not impossible.
Strategic Focus: Hunt near doe bedding areas or pinch-points and saddles bucks use as they search for the next estrus doe.
Hunters must infiltrate the bedroom areas of these bucks, often found near doe bedding spots. Funnels, such as pinch-points and saddles, also present productive hunting locations. Continue with aggressive calling and decoying tactics.
Post-Rut: November 21-30
By this point, the majority of does have been bred, and hunting pressure has likely driven deer into thicker cover.
Strategic Focus: Shift to more cautious tactics, concentrate on thick cover where bucks might take refuge, and exercise patience.
Intensified hunting pressure prompts bucks to respond cautiously. Focus on secure cover areas where mature bucks may seek shelter.
Second Rut: December 1-15
As the primary rut phase subsides, a second rut phase commences. Some does that were not bred during the first rut cycle, along with sexually mature doe fawns, enter estrus again.
Strategic Focus: Concentrate on bed to feeding area buck patterns and be prepared for any rutting activity as a bonus.
Bucks may follow does to food sources during this phase, and encountering estrus doe fawns can lead to sightings of mature bucks in daylight hours. Reserve calling and rattling for later in this phase when bucks may respond more vigorously.
The Art of Vocalization: Research shows that vocalizations play a vital role in rut season. Deer emit guttural grunts, while elk produce haunting bugles. These sounds serve as both an invitation to potential mates and a challenge to rival males. For hunters, these vocalizations act as auditory beacons, guiding them to the action.
With unique strategies like calling techniques, scent management, precise stalking, and advanced trail camera technology, hunters can maximize their chances of success during this exhilarating period. Rut season is not just a hunting experience; it’s a profound connection with nature. So, gear up and embrace the untamed beauty of the wild!
Cracking the Rut Season Code | Mastering Rut Season Strategies Read More »