Steven Sparks | Backwoods Land Co.

Powered By EmbedPress

This 294 acre tract in Alcorn County, MS is a turnkey hunting and timber tract. Located just 3 miles from the Tuscumbia River, this tract benefits from its proximity to the surrounding wetlands, which are known to be a key stopover along the Mississippi Flyway. While primarily suited for deer hunting, the fertile creek bottoms in the low lying wetland areas of the property may also create suitable conditions for attracting waterfowl during migration seasons. Walnut is also well known from prime turkey hunting. The combination of varied terrain and water access enhances the tracts hunting versatility.
The natural ridges, valleys, and gentle slopes create ideal movement corridors for deer. These natural features form good pinch points, while multiple cleared areas would make ideal food plots. A 672 sq. ft. manufactured home, featuring 2 bedrooms and 1 bathroom, serves as a convenient hunting camp with power and water. Additionally, power and water and fiber are available at the road (County Road 762), with multiple prime spots along the road.
In addition, this tract features a rich stand of bottomland hardwoods, shortleaf, and loblolly pines. The combination of wildlife and timber make this property valuable in more ways than one.
Conveniently located within easy driving distance to Ripley (18 miles), Corinth (30 miles), Tupelo (50 miles), and Memphis (70 miles), this property offers the perfect blend of outdoor recreation and accessibility.
 
🦌 Prime deer and turkey hunting
🦆 Potential waterfowl opportunities due to lowlying wetland bottoms portion and proximity the Mississippi Flyway
🌲 Rich timber resources: bottomland hardwoods, shortleaf, and loblolly pines
🏠 672 sq. ft. hunting camp with power and water
🔌 Utilities (power, water, fiber) available at the road
📍 Multiple building sites
🏫 Located in the Alcorn County School District
🚗 Easy access to Ripley, Corinth and Tupelo
 
☎️ Steven Sparks 662-523-4503
☎️ Office: 601-209-4882
Facebook
Twitter
LinkedIn

Powered By EmbedPress

Real Estate

Multi-use Land Opportunity: Ideal for Commercial, Residential, and Agricultural Development on Hwy 45 in Nettleton, MS

Multi-use Land Opportunity: Ideal for Commercial, Residential, and Agricultural Development on Hwy 45 in Nettleton, MS

Facebook
Twitter
LinkedIn
Looking for an ideal location for a business or dream home? We present a unique opportunity: three parcels zoned for commercial, residential and agricultural use. Fronting Hwy 45 and Old 45 with over 2000 ft of road frontage, the 17-acre commercial tract offers high visibility and potential for diverse uses. A stone’s throw from Nettleton, perfect for local and pass-through traffic. The 10-acre residential parcel presents an opportunity for those desiring to build a home, with around 1900 ft of road frontage that extends to both W Main St and Hwy 45, and a good mixture of hard and softwoods, this tract merges the possibilities of convenience of town living while maintaining a sense of comforting rural surroundings. Lastly, a 1.60-acre tract zoned agriculture use further expands possibilities!
All info is subject to verification. Taxes shown are for parent parcels, not exact totals.
Contact me for a showing today! 👉👉662-523-4603

Multi-use Land Opportunity: Ideal for Commercial, Residential, and Agricultural Development on Hwy 45 in Nettleton, MS Read More »

The Evolution of the Pulpwood Industry in Mississippi

The Evolution of the Pulpwood Industry in Mississippi and Prices


Mississippi, endowed with abundant fertile forests, holds a significant place in America’s pulpwood industry. The industry has witnessed a roller-coaster ride of stumpage and pulpwood prices over the years. The mid-20th century saw a surge in the pulpwood industry in Mississippi due to the construction of numerous pulp and paper mills, leading to increased pulpwood demand. However, the advent of the 21st century brought along technological advancements and imported pulpwood, unsettling the market, causing price fluctuations for stumpage and pulpwood per ton. Lets discuss what these terms mean.

When we talk about a ‘cord’, it refers to a specific forestry measurement which equals a stack of wood 4 feet high, 4 feet wide, and 8 feet long, often used for firewood. ‘Price per ton’ reflects the cost per ton of pulpwood, a type of timber primarily used for paper manufacturing. Factors such as the timber’s quality, tree species, demand, and accessibility significantly influence the price per ton of pulpwood.

Now, let’s get into some calculations. Imagine you have a 100-acre forest that generates 3.2 tons of timber per acre each year, of which 37.5% is pulpwood. Therefore, each acre produces 1.2 tons of pulpwood annually (3.2 tons x 37.5%). Over your entire 100-acre forest, that amounts to 120 tons of pulpwood each year (1.2 tons per acre x 100 acres).

If the stumpage price, which is the amount a landowner is paid for standing timber, is $2.00 per ton, then the total value of your pulpwood each year would be $240 (120 tons x $2.00 per ton).

Next, let’s convert this to cords. A cord of wood typically weighs around 2 tons. Therefore, the 120 tons of pulpwood you’re producing each year equates to approximately 60 cords of pulpwood (120 tons ÷ 2 tons per cord). With the stumpage price of $2.00 per ton, each cord is worth approximately $4.00 ($2.00 per ton x 2 tons per cord). So, the total annual value of your pulpwood, if measured in cords, would still be $240 (60 cords x $4.00 per cord).

In conclusion, the value of the pulpwood you can harvest from your 100-acre forest, whether calculated in tons or cords, comes out to be the same at $240 per year at the current stumpage price of $2.00 per ton. This underlines the importance of understanding and correctly using forestry measurements in the timber industry.

Today, in the mid-2020s, the pulpwood industry in Mississippi continues to evolve. The proliferation of digital technology has led to a decline in paper products, thereby reducing pulpwood demand. Despite the diminished demand, Mississippi’s forests continue to produce a substantial amount of pulpwood, leading to an oversupply and putting downward pressure on stumpage and pulpwood prices per ton. The industry is navigating this scenario by exploring new pulpwood applications, such as bioenergy production, particularly in the form of wood pellets for energy.

Despite the challenges, Mississippi’s pulpwood future appears promising due to its potential to leverage its rich forest resources for innovation and adaptability. While traditional pulpwood usage for paper production might be dwindling, burgeoning markets like bioenergy and engineered wood products could open new avenues for growth. Thus, the pulpwood industry in Mississippi is in a constant state of flux, faced with challenges, yet its rich history and potential for innovation and new opportunities.


 Factors Influencing Paper-Making Wood Prices in Southern US


Understanding the influence of roundwood pulpwood supply and demand on its pricing is complex, primarily due to the availability of sawmill leftover chips as an alternative. The recent decade’s lumber production surge in the south has increased leftover chip production, helping maintain roundwood pulpwood prices stability. A thorough understanding of pulpwood pricing complexities can help decipher pricing trends.

Between 2015 and 2019, most southern region states experienced relatively minor changes (less than 10%) in pulpwood demand and its pricing. However, Alabama, Arkansas, Mississippi, and North Carolina deviated from this pattern. In these states, prices fell despite a slight drop in demand, or demand outpaced price increases. From 2019 to 2022, pulpwood prices soared by 10% or more in three states, with only Alabama witnessing a corresponding demand increase.

Comparing demand changes with pulpwood price changes from 2019 to 2022 reveals less correlation between price responses and demand changes. Contrarily, many states exhibit a negative relationship with demand. Unlike the more direct relationship between sawlog demand and prices, pulpwood prices are influenced by by factors like leftover chips, demand for oriented strand board, wood pellets, and pulp markets and exports.


Understanding Tree and Lumber Market Mechanisms


The tree and lumber markets operate differently, influenced by distinct pricing trend factors. Trade volumes, supply conditions, and demand factors play pivotal roles. Lumber, a heavily traded product, is highly susceptible to daily events, resulting in frequent, sometimes unpredictable price changes.  The tree market is less reactive to daily events, with tree prices being more affected by long-term trends such as forest growth rates, harvesting costs, and overall timber product demand.

By mid-2021, this trend seemed to be shifting. Despite economic uncertainties, the robust housing market required substantial lumber, reflecting high demand in southern sawtimber prices, which peaked to a 14-year high. However, 2022 witnessed a decline, and by 2023, lumber prices bottomed out due to a decrease in new construction. The National Association of Home Builders predicts a decrease in housing starts to approximately 744,000 single-family homes in 2023, as builders continue to cut back despite a housing shortage.

The below chart is a current snapshot of lumber prices USD/1000 Board Ft


Pulpwood prices at end of 2002 below


During a housing boom, the demand for various timber products, including pulpwood, generally increases. This is because a surge in housing construction requires more raw materials, including timber for construction and pulpwood for paper-based products such as wallpaper, insulation, and cardboard used in packaging. When demand increases, it can lead to a rise in pulpwood prices as suppliers try to meet the greater need for their products.

However, the relationship between a housing boom and pulpwood prices isn’t as direct as with other timber products. This is mainly because the primary use of pulpwood is for paper products, not directly for construction. While certain types of timber such as sawlogs are directly used in housebuilding, leading to a more immediate and significant price impact during a housing surge, pulpwood doesn’t experience the same level of price fluctuation. The price of pulpwood is more influenced by the demand for paper products, which can be affected by a variety of factors, including digitalization trends, recycling rates, and global market dynamics.

Despite this, it’s important to note that a housing boom can indirectly affect pulpwood prices. For instance, increased construction activity can lead to a greater need for packaging materials, which are often made from pulpwood. This can result in a modest increase in pulpwood prices, even though the effect may not be as pronounced or immediate as it is for timber directly used in construction. So, while pulpwood prices may see some increase during a housing boom, they are somewhat separate from the direct influence of housing construction compared to other timber products.

Emerging Markets: Bioenergy and Engineered Wood Products

Pulpwood in Mississippi is finding new uses beyond traditional paper production, with its conversion into wood pellets for bioenergy production being one of the most significant. As the world shifts towards renewable energy sources, the demand for biomass in the form of wood pellets is growing, creating a new market for pulpwood growers. Mississippi’s location, near the Gulf of Mexico, provides a logistical advantage for shipping wood pellets to Europe, where the demand for bioenergy is particularly high. This emerging market could potentially counterbalance the declining demand for pulpwood for paper production.


Future Pathways: Forestland Investment and Forest Management


While the forest products market dynamics continuously shift, some trends can guide investors and managers to anticipate market changes.

  1. Climate Change and Forest Management: Climate change increasingly impacts the forest products market. Changes in weather patterns can affect forest growth rates and pest and disease occurrences, influencing timber production and prices. Additionally, growing interest in forests as carbon sinks could create new markets for forest carbon credits.
  2. Technological Innovations: Technological breakthroughs in remote sensing and data analysis are revolutionizing forest management. These technologies can enhance forest inventory data, optimize harvest operations, and improve supply chain efficiency, leading to higher profits for forestland owners and managers.
  3. Shifting Demand Patterns: Demand for forest products can fluctuate due to factors like population growth, economic conditions, and consumer preferences. For instance, there is a rising demand for sustainable and renewable forest products, which can create new opportunities for forestland owners and managers.
  4. Investment Trends: The timberland investment landscape is also evolving. While institutional investors have historically dominated the timberland investment space, there is growing interest from individual investors and family offices, which could alter timberland investment structures and management.
Resources and Links


  1. US Forest Service – This federal agency provides a wealth of information on forests and forestry in the United States, including research, statistics, and resources on sustainable forest management. US Forest Service
  2. Mississippi State University Extension Service – This extension service offers resources and educational programs on forest and wildlife resources in Mississippi. MSU Extension
  3. National Association of Home Builders – This trade association provides data and forecasts on the housing market in the United States, which can affect demand for lumber and timber products. NAHB
  4. Timberland Investment Resources, LLC – This company offers information and services related to timberland investment. They also provide a blog that covers various aspects of investing in timberland. Timberland Investment Resources
  5. The Forest History Society – This organization offers a wide range of resources on the history of forests and forestry, including the evolution of the timber industry and forest management practices. The Forest History Society

The Evolution of the Pulpwood Industry in Mississippi Read More »

Sow Kudzu, Sow Prosperity | History and Impact of Kudzu Cultivation

The Champion of the Kudzu Cause: Channing Cope

Enter the story of Channing Cope. Operating out of Covington, Georgia, Cope had access to the airwaves that reached farmers across the South. He cleverly used this platform to become the champion of the ‘kudzu cause’, passionately advocating its benefits for soil conservation. Through his radio show and his column in The Atlanta Constitution, he spread the gospel of kudzu so extensively, one could almost see the vine growing in his listeners’ minds.

The Journey of Kudzu: From Panacea to Nemesis

The journey of kudzu began in 1876 when it was imported from Japan for the Philadelphia Centennial Exposition. Its rapid growth and attractive blossoms soon caught people’s attention. However, during the 1930s’ Dust Bowl, this fast-growing vine was seen as a panacea for soil erosion. The U.S. Soil Erosion Service even endorsed the widespread planting of kudzu. Little did they realize that this “miracle vine” would soon become the South’s nemesis. Together with Channing Cope, they unknowingly laid the groundwork for the green monster that kudzu would become.

The Kudzu Club of America and the Growth of a Green Monster

In the 1940s, Cope even kicked off the “Kudzu Club of America,” amassing over 20,000 members. The club’s motto was as simple: “Sow kudzu, sow prosperity.” It was the perfect jingle for the times, dovetailing with the U.S. government’s promotion of kudzu. But our friend Cope, couldn’t see the future repercussions of his campaign. The vine, no longer held back by the natural checks and balances of its native environment, went to town. It smothered native plants, gave trees the ‘kudzu hug of death’, and draped over homes and buildings like a tacky green Christmas decoration. By the time scientists stepped in to say, “Hey, um, we might have a kudzu problem,” the vine had taken root in every sense of the word.

The Lessons from Kudzu: Consider the Consequences

This should remind us of the importance of pausing to consider the possible fallout before introducing a new species into an environment. It also serves as a lesson in the power of media and popular figures in shaping public opinion and actions. Channing Cope’s legacy and story is a testament to our complicated relationship with this plant and a reminder that even the best intentions can sometimes lead us down a garden path…to a whole lot of kudzu.

Kudzu: An Emblem of Southern Grit and Adaptability

Folks born and raised in the south have become intimately familiar with the relentless expansion of this vine. This robust plant, while not native, has become an emblem of Southern grit and adaptability. It’s etched itself into our narrative and is part of our story. Today, we’re still wrestling with the aftermath of this “vine that swallowed the South”.

Applying Herbicides: Techniques and Timing

One method to control kudzu is through chemical intervention. Herbicides such as glyphosate and triclopyr have proven to be efficacious, but they demand careful application The application can be executed using various techniques, like backpack sprayers for smaller infestations or truck-mounted sprayers for larger tracts. For extensive kudzu fields, aerial spraying utilizing drones or helicopters can be employed, albeit requiring special permissions and expertise. The optimal time for spraying is late summer or early autumn when the kudzu is storing nutrients for the winter. The procedure involves spraying the plant’s leaves and letting the herbicide travel to the roots. This process may need repetition over two to three years to ensure the kudzu’s complete eradication.

Prescribed Burning: An Effective Tandem Method

Prescribed burning is another method that, combined with herbicide application, can yield high effectiveness. However, it’s important to note that burning alone will not eliminate kudzu, given the plant’s extensive root system that enables it to regenerate. Burning should be used in tandem with herbicides for it to be effective, and it should always be conducted by professionals trained in fire management.

Herbicides and Burning: A Strategic Combination

When employing a combination of herbicides and prescribed burning, you first apply the herbicide, wait for the kudzu to wither (which may take several weeks to a couple of months), and then initiate the burn. This ensures that the chemical has had enough time to reach the root system, and the fire is more effective in clearing the dead kudzu.

Kudzu’s Winning Strategy and Growth Mechanism: Sunlight, Photosynthesis, and Runners

Kudzu doesn’t strangle its plant rivals. No, it’s more subtle. It simply smothers them under a thick cover of leaves, effectively blocking out sunlight. Kudzu’s winning strategy against other plants boils down to a few factors. Firstly, it has a massive amount of leaf surface area relative to its structural parts, meaning it can soak up a lot of sunlight. Secondly, it’s a pro at photosynthesis, turning sunlight into energy with impressive efficiency. Lastly, its leaves adjust their position throughout the day to ensure lower leaves get enough sun and upper leaves don’t get too toasty.

Spreading kudzu seeds isn’t its style. Instead, it grows by sending out runners that put down roots at different points. These new roots can grow into large tubers that can resist herbicide treatments for many years.

The Financial Impact of Kudzu: A Nightmare for Industry

Financially, kudzu is a nightmare. It reduces the worth and quantity of timber. Currently, kudzu blankets over seven million acres across the U.S. and is expanding at a rate of about 120,000 acres annually. U.S. data shows that kudzu inflicts economic damage to the tune of $100 million each year. This includes the productivity losses in forestry, power and railroad companies, national and state parks, and agricultural lands, as well as the increased costs for managing and maintaining kudzu-infested areas. Forestry companies usually shell out about $500 per acre each year to control kudzu. Power companies fork over around $1.5 million per year to manage kudzu issues and offset power loss.

Cost of Kudzu Extermination: A Pricey Battle

Now, onto the cost of kudzu extermination. It can vary depending on the size of the infestation, the terrain, and the specific methods used. But on average, you can expect to spend between $100 to $400 per acre per year for a chemical treatment. This sum includes the cost of the herbicides and the labor to apply them. Over a three-year period, typically the minimum time required to ensure total eradication, this equates to a range of $300 to $1,200 per acre.


The Cost of Prescribed Burns: An Additional Expense

The cost of prescribed burns can also fluctuate based on local regulations, labor costs, and the need for repeat burns. However, you can anticipate spending roughly $50 to $200 per acre for each burn. If you conduct this annually for three years, that’s an additional $150 to $600 per acre.

The Kudzu Story: A Cautionary Tale

And so, that’s the story of how kudzu went from being the next big thing in soil conservation to the uninvited guest that won’t leave the party even after it’s over. It’s a classic tale of “be careful what you wish for.” We wanted a quick fix for soil erosion, and boy, did we get it.

Links and Resources: Learning More about Kudzu

  1. The Kudzu Plant: Profile of an Invasive Vine – National Park Service’s detailed article on Kudzu, its characteristics, and its impact on the environment. http://www.nps.gov/articles/kudzu.htm
  2. Invasive Species: Kudzu – Information about Kudzu from the U.S. government’s National Invasive Species Information Center. http://www.invasivespeciesinfo.gov/profile/kudzu
  3. The Economic Impact of Kudzu – An academic study on the economic consequences of Kudzu infestation, available through JSTOR. http://www.jstor.org/stable/10.2307/12345678
  4. Methods for Controlling Kudzu – USDA Forest Service’s guide on various methods for controlling and eradicating Kudzu. http://www.fs.fed.us/research/invasive-species/plants/kudzu.php
  5. Kudzu in Georgia: History, Uses, and Control – A comprehensive resource from the University of Georgia Extension detailing the history of Kudzu in Georgia and methods for its control.

Sow Kudzu, Sow Prosperity | History and Impact of Kudzu Cultivation Read More »

North Mississippi Market Analysis and Land Trends

North Mississippi Current Land Trends

The Price Per Acre by Land Type and Average Price per Acre Graph in the lower left corner demonstrates that land value is closely linked to its location. However, there are observable differences in price per acre across various land types. Agricultural land, for example, has a high correlation with its size, although prime agricultural land tends to be situated in outlying areas of towns that are in higher demand. This can be attributed, in part, to the tendency for towns to be built on flat terrain with soils that favor prime farmland. Furthermore, topography is typically associated with agricultural land, although there are exceptions to this rule.

In the upcoming study, the correlation between counties, acreage, area, and price per acre will be further analyzed. It has been observed that the diminished returns for larger acreage apply to all of these categories, unless the property is located in a prime area. It is worth noting that the value of cleared land has increased over the past few years.

Further analysis of the land sales is broken down by features, which can be quite detailed and time-consuming to identify correlations and trends. If you enjoy solving puzzles, this task may be a fun challenge for you!

Analysis Of the Broader Land Market

Market Analysis of Lots Between 30-50 acres

This market analysis includes an inventory analysis covering the prior 7-12 months, prior 4-6 months, and current 3 months. It is important to keep in mind that the next to brief market analysis provides a general overview of the North MS Board of Realtors Land market, and that other factors such as property type, location, and features should also be taken into consideration when making specific evaluations or decisions. However, based on the data presented in the analysis, certain conclusions can be drawn regarding the supply and demand factors affecting land in similar acreage ranges.

Over the past 7-12 months, there were a total of 22 comparable sales (settled), resulting in an absorption rate of 3.67 sales per month. For the prior 4-6 months, there were 8 comparable sales and an absorption rate of 2.67 sales per month. For the current 3 months, there have been 7 comparable sales and an absorption rate of 2.33 sales per month.

There were 18 active listings as of September 21, 2022, 23 active listings as of December 21, 2022, and 25 active listings as of March 22, 2023. Based on the absorption rate, this corresponds to a months of housing supply of 4.9 months, 8.61 months, and 10.73 months, respectively.

Regarding median sale and list prices, as well as days on market and sale-to-list price ratios, there were some fluctuations across the different time periods. The median comparable sale price over the past 7-12 months was $111,250, while the median comparable sale price for the prior 4-6 months was $94,800. In the current 3 months, the median comparable sale price was $98,000. The median comparable sales days on market (DOM) for the prior 7-12 months was 98 days, while for the prior 4-6 months it was 125 days, and for the current 3 months it was 63 days.

The median comparable list price for the prior 7-12 months was $167,500, and for the prior 4-6 months it was $182,500. In the current 3 months, the median comparable list price was $225,000. The median comparable listings DOM for the prior 7-12 months was 273 days, for the prior 4-6 months it was 200.5 days, and for the current 3 months it was 170 days.

Finally, the median sale price as a percentage of the list price was 94.00% for the prior 7-12 months, 78.00% for the prior 4-6 months, and (data missing) for the current 3 months

Market Analysis of Lots Between 10-20 acres

This market analysis presents an inventory analysis for the prior 7-12 months, prior 4-6 months, and current 3 months. During the prior 7-12 months, there were 25 comparable sales (settled) with an absorption rate of 4.17 sales per month. During the prior 4-6 months, there were 17 comparable sales with an absorption rate of 5.67 sales per month. During the current 3 months, there have been 7 comparable sales with an absorption rate of 2.33 sales per month.

The total number of active listings was 34 as of September 21, 2022, 50 as of December 21, 2022, and 73 as of March 22, 2023. Based on the absorption rate, the corresponding months of housing supply were 8.15 months, 8.82 months, and 31.33 months, respectively.

Regarding median sale and list prices, days on market, and sale-to-list price ratios, there were some fluctuations across the different time periods. The median comparable sale price for the prior 7-12 months was $85,000, while for the prior 4-6 months it was $51,000, and for the current 3 months it was $60,921. The median comparable sales days on market for the prior 7-12 months was 65 days, while for the prior 4-6 months it was 51 days, and for the current 3 months it was 253 days.

The median comparable list price for the prior 7-12 months was $107,450, while for the prior 4-6 months it was $99,450, and for the current 3 months it was $99,500. The median comparable listings days on market for the prior 7-12 months was 324 days, while for the prior 4-6 months it was 262 days, and for the current 3 months it was 106 days.

Finally, the median sale price as a percentage of the list price was 88.00% for the prior 7-12 months, 94.00% for the prior 4-6 months, and 90.00% for the current 3 months.

Expired Listings Between 30-50 Acres

The massive amount of expired listings in this market analysis is likely a result of overpricing. As seen in the data, there were 573 listings that expired without being sold, which is a significant number compared to the number of active, pending, and closed listings.

The average list price of the expired listings is $253,309, with a median price of $119,000 and a high of $8,500,000. The average days on the market for these listings is 360 days, which is significantly higher than the average days on the market for active and pending listings. This indicates that these listings may have been overpriced, which resulted in them not being sold within a reasonable time frame.

On the other hand, the closed listings have an average sale price of $157,108, with a median price of $114,900 and a high of $1,850,000. The sale-to-list price ratio for these listings is 0.90, which is relatively close to the asking price. Additionally, the average days on the market for closed listings are 133 days, which is significantly lower than the average days on the market for expired listings.

Overall, this analysis suggests that overpricing is a significant factor in the high number of expired listings. It is important for sellers to work with a real estate agent who can provide a realistic and accurate valuation

MUCH MORE TO COME!

There is much more to come, so please be sure to follow me on the website and social media for the latest updates. If you’re looking for a customized consultation that specifically fits your needs, feel free to contact me via phone or text 662-523-4603, or email  ssparks@wesleywebb.com at any time to schedule an appointment. Thank you for taking the time to read this!

North Mississippi Market Analysis and Land Trends Read More »

Comprehensive Marketing Strategy for Selling Land, Commercial and Residential Real Estate

With a free estimate of value from a state-certified real estate appraiser, my plan provides a straightforward and honest estimate of your property’s value. That’s the first step. Included is a comprehensive and customized marketing strategy. By targeting the right audience, utilizing multiple marketing channels, and adjusting our strategies based on performance data and feedback, we are confident that we can achieve a successful sale of your land.


Step 1: Free Estimate of Land Value by a State Certified Real Estate Appraiser


  1. Marketing time: The estimated duration it will take to sell the property, taking into account current market conditions and trends.
  2. List-to-sale price ratio: The anticipated ratio between the listing price and the final sale price, which can help you set a competitive listing price that reflects the property’s true value.
  3. Key metrics: Some other crucial metrics to consider when evaluating your property’s value include:
    • Comparable land sales: Analyzing recent sales of similar properties in the area to gauge market value.
    • Property features and improvements: Evaluating any existing infrastructure, such as roads, fencing, or irrigation systems, that may impact the land’s value.
    • Location and accessibility: Considering the property’s proximity to amenities, schools, and major transportation routes.
    • Zoning and land use potential: Assessing how the land’s zoning and potential uses could impact its value and appeal to potential buyers.


Step 2: Target Audience Based on the property’s features and zoning, our target audience includes:


  1. Land buyers interested in recreational or hunting properties: If the property has features such as forests, water sources, or wildlife habitats, it may be appealing to buyers seeking land for recreational purposes or hunting. I will showcase the property’s natural resources, recreational opportunities, and the abundance of local wildlife to attract buyers interested in using the land for hunting, fishing, or other outdoor activities.
  2. Local farmers looking to expand their operations: Your property’s size and agricultural zoning make it an attractive option for farmers in the area seeking additional land to grow their businesses. I will emphasize the fertility of the soil, water availability, and any existing infrastructure, such as barns or irrigation systems, to appeal to this audience.
  3. Timber investors seeking land for forestry or timber production: If your property has significant forested areas or a variety of tree species suitable for timber production, it may be attractive to timber investors or companies involved in the forestry industry. I will emphasize the property’s timber resources, forest management potential, and any existing timber inventory data or growth projections to appeal to this audience.
  4. Families interested in building a custom home with ample space for recreation: With its size and scenic surroundings, your property is an ideal choice for families who want to build a custom home with plenty of space for outdoor activities. I will showcase the property’s privacy, natural beauty, and accessibility to nearby schools, shopping, and recreation facilities to appeal to these buyers.
  5. Hobby farmers or homesteaders seeking a self-sustainable lifestyle: Your property’s size and fertile land make it an ideal choice for individuals or families interested in pursuing a self-sustainable lifestyle by growing their own produce, raising livestock, or starting a small-scale farm. I will emphasize the property’s agricultural potential, water sources, and suitability for various types of crops and animals.
  6. Entrepreneurs looking for land for commercial purposes: The property’s location and potential for commercial zoning could attract entrepreneurs or small business owners interested in establishing businesses such as campgrounds, wedding venues, vineyards, or agritourism enterprises. I will showcase the property’s accessibility, visibility, and potential for commercial development.
  7. Investors searching for land with appreciation potential: The property’s location and future development possibilities make it appealing to investors seeking long-term value appreciation. I will focus on the potential for rezoning, nearby infrastructure projects, and growth trends in the region to attract investors interested in land banking or strategic land investments.
  8. Equestrian enthusiasts seeking land for horse facilities: Your property’s size, terrain, and accessibility make it an excellent option for those looking to establish an equestrian facility, such as a horse farm, training center, or riding school. I will emphasize the potential for building stables, paddocks, and riding arenas, as well as the property’s proximity to riding trails and equestrian communities.
  9. Non-profit organizations or community groups: The property’s location, size, and zoning could make it attractive to non-profit organizations or community groups looking to establish retreat centers, educational facilities, or other community-focused projects. We will highlight the property’s potential for development, proximity to local resources, and any available grants or incentives for community-oriented projects.
  10. Conservation organizations or nature lovers: If the property has unique ecological features, such as wetlands, forests, or wildlife habitats, it may be of interest to conservation organizations or individuals passionate about preserving natural areas. I will highlight the property’s ecological value, biodiversity, and potential for conservation easements or stewardship programs.
  11. Renewable energy companies seeking land for solar or wind projects: If the property has suitable topography, solar exposure, or wind.


Step 3: Property Presentation I will create a professional and compelling property presentation that includes:


  1. A detailed written description highlighting key features, such as the land’s size, location, zoning, access, and utilities.
  2. High-quality photographs showcasing the property’s terrain, views, and surrounding area.
  3. A drone video tour to provide a unique perspective of the property.
  4. Property boundary maps and any relevant documentation (e.g., land surveys, environmental reports).


Step 4: Online Marketing Channels Our online marketing strategy will utilize the following channels:


  1. Our company website: I will feature your property on our homepage, Wesley Webb Real Estate | Real Estate Professionals for Existing Homes, New Construction, Land (wwebbms.com), with a dedicated listing page containing the property presentation, photos, and contact information. I will also list the property on own personal website Home – Steven Sparks | Wesley Webb Real Estate (sparkslandandcommercialproperties.com) that includes IDX. It enables me to provide up-to-date and accurate property information to my clients and helps me attract more potential buyers by providing a wider range of listings. Follow my blog – Blog – Steven Sparks | Wesley Webb Real Estate (sparkslandandcommercialproperties.com).
  2. Social media platforms: We will create targeted posts on Facebook, Instagram, Twitter, and LinkedIn, sharing the property presentation, photos, and video tours.
  3. Real estate websites and land-specific listing services: Your property will be listed on popular platforms such as , our Multiple Listing Services, Land and Farm, Zillow, LandWatch, and Lands of America, Loopnet and more.
  4. Targeted Google Ads and Facebook Ads campaigns: We will create ads specifically designed to reach our target audience in the local area and surrounding regions.


Step 5: Print Advertising and Local Promotion Our print advertising and local promotion efforts will include:


  1. Full-page ads in local newspapers, real estate magazines, and agricultural publications.
  2. Professionally designed brochures and flyers, distributed at local businesses, community centers, and farmers’ markets.
  3. Eye-catching yard signs placed on the property to draw attention from passersby.


Step 6: Networking and Industry Connections We will leverage our professional network to promote your property

by:


  1. Informing local land brokers, real estate agents, and developers about the property and its potential uses.
  2. Participating in industry events, conferences, and local networking meetings to showcase the property and connect with potential buyers.


Step 7: Property Tours: By request, I will organize guided property tours by:


  1. Scheduling appointments: Arranging convenient times for interested parties to visit the property, ensuring that the tour accommodates their schedule and preferences.
  2. Preparing the property: Prior to the tour, I will make sure that the property is presentable and that any important features are easily accessible and visible to potential buyers. This may involve highlighting marking boundaries, or highlighting key points of interest.
  3. Personalized on-site tours: I will personally accompany potential buyers on a tour of the property, providing them with detailed information about the land, its features for the use the buyer is looking for, and any development potential. I will also answer any questions and address any concerns they may have during the tour.
  4. Virtual tours (if applicable): In addition to in-person tours, I can offer virtual tours through video calls, pre-recorded video walk-throughs, or interactive 360-degree virtual tours. This option allows interested parties who cannot visit the property in person to explore the land remotely and get a sense of its features and potential.
  5. Providing follow-up information: After the tour, I will provide potential buyers with any additional information or documentation they may require, such as property surveys, environmental reports, or zoning regulations. I will also follow up with them to gauge their interest, gather feedback, and address any further questions or concerns they may have.


Step 8: Direct Mail Campaign We will design and execute a targeted direct mail campaign by:


  1. Creating a mailing list of potential buyers based on our target audience, including local farmers, hunters, developers, commercial buying prospects etc. and families looking for land
  2. Sending personalized postcards featuring property photos, key features, and an invitation to private property tours.


Step 9: Monitoring and Adjusting Marketing Efforts – I will regularly review and adjust our marketing strategies by:


  1. Tracking metrics, such as website traffic, listing views, inquiries and more.
  2. Adjusting our marketing plan based on performance data to optimize results and ensure that we’re reaching the right target audience effectively: Using the data gathered through tracking, feedback, and market research, we will make informed decisions to adjust our marketing plan as needed.


           Step 10: Client Communication and Updates Maintaining open communication with you, our client, is essential. I will provide regular updates on our marketing efforts by:


  1. Scheduling bi-weekly or monthly calls to discuss the progress of our marketing plan, including inquiries, property showings, and any potential offers.
  2. Providing detailed reports on the performance of our marketing strategies, including website traffic, social media engagement, and ad campaign results.
  3. Updating you on any changes in the local real estate market or relevant news that may impact the sale of your property.

          Step 11: Feedback from Potential Buyers Collecting and utilizing feedback from potential buyers is crucial in refining our marketing efforts. I will:


  1. Follow up with potential buyers and attendees of property tours to gather their feedback and impressions of the property.
  2. Use this feedback to adjust our property presentation, pricing strategy, or marketing efforts, if necessary, to make the property more attractive to our target audience.


        Step 11: Offer Negotiation and Closing Support Our goal is not only to market your property effectively but also to secure the best possible deal for you. I will:


  1. Review all offers received and provide guidance on their pros and cons, helping you make an informed decision
  2. Negotiate on your behalf to secure the most favorable terms and conditions for the sale of your property
  3. Coordinate with all involved parties, including attorneys, title companies, and lenders, to ensure a smooth closing process

Conclusion: My comprehensive and customized marketing plan is designed to sell your property quickly and for the best possible price. By targeting the right audience, utilizing multiple marketing channels, and adjusting our strategies based on performance data and feedback, I am confident that we can achieve a successful sale of your land. I look forward to working with you and guiding you through this process.

Comprehensive Marketing Strategy for Selling Land, Commercial and Residential Real Estate Read More »

How to Avoid Being Misled by Price Per Square Foot | Discover the Limitations of Price Per SF

Price per square foot (PSF) is a common metric used in real estate to compare the value of homes or properties. However, it can be misleading, especially when it comes to rural properties with homes.

Here are a few reasons why PSF can be misleading for rural properties:

  1. Varying Condition: For example, two homes with the same square footage may have vastly different values if one is in excellent condition with modern finishes, 4,500 sf while the other is 1,200 sf in need of some minor updates in overall average condition, yet has a 900 sf new shop with living quarters and other outbuildings and workspaces, an 18 stall high-end horse barn with large tack room with a good sized stock fishing lake on 10 acres in a secluded yet desirable area, yet, their PSF could still be close to the same. In this case, the PSF would not accurately reflect the value of each property.
  2. Varying Land Sizes: Rural properties often have larger land sizes compared to urban or suburban areas. As a result, the price per square foot calculation can be heavily skewed by the size of the land. A property with a large land size may have a lower price per square foot compared to a smaller property, even if the larger property is more valuable due to diminished returns.
  3. Varying Home Sizes: Rural homes also tend to have varying home sizes. Some homes may be large with multiple bedrooms and bathrooms, while others may be small cabins. PSF can be misleading in this scenario since larger homes will naturally have a lower PSF than smaller homes, even if they are of similar quality due to yet again, diminished returns.
  4. Varying Amenities: Rural properties may have unique features such as a pond, a barn, or a farm. These features add value to the property, but they are not reflected in the PSF calculation. Therefore, the PSF may not accurately represent the overall value of the property.
  5. Varying Quality: Rural homes can also vary in quality, which can affect the overall value. For example, a newly built home will have a higher PSF than an older home in need of repairs, even if the older home is on a larger piece of land or has unique features.


PSF can be misleading when it comes to rural properties since it does not take into account various factors such as land size, home size, amenities, and quality.


In urban and suburban areas with subdivisions, PSF can be a little more of a helpful tool in determining the value of homes. Especially in cutter cutter subdivisions with similar lot sizes. However, it is important to note that PSF does not always accurately reflect the value of a property, even in these areas. Especially when calculation the overall price per sf trends in the area.

Here are a few reasons why PSF can be misleading when comparing overall price per sf values in suburban and urban areas:

  1. Quality: While homes in subdivisions may have similar square footage, there can be differences in the quality of construction, materials used, and finishes. These factors can significantly affect the overall value of a property but are not reflected in the overall average PSF calculation in the area.
  2. Condition: The condition of a property, including maintenance and updates, can also impact its value. A home that has been well-maintained and updated will have a higher value than a similar home that has not been properly maintained, yet their PSF could be the same if the home that has no updates but has been well maintained has somewhat higher quality of finish and has a two car garage with a basement.
  3. Location: The location of a property can also affect its value. A home on a busy street or near a noisy highway will typically have a lower value than a similar home in a quieter location. PSF does not take into account exact location of the property and say, the a beneficial views and/or other appealing  or negative external factors, even though they are in the same immediate neighborhood.

When it comes to evaluating properties, PSF can provide greater accuracy in suburban and urban areas with homes that have similar lot and heated sf sizes than in rural areas, however, it may not accurately reflect the overall value of a property that has varying amenities like pools, garages, and outdoor living spaces. These amenities can differ significantly from one property to another and can have a significant impact on the property’s value. As PSF does not take these amenities into account, it can be misleading to compare properties based solely on their PSF.

Finally, diminished returns can have a profound effect on price per sf in all types of area.

Diminishing returns is a concept that describes how the marginal benefit of adding more of a certain input to a production process gradually decreases. In the context of real estate, this concept can have a significant impact on how we interpret and analyze data such as price per square foot (psf).

Price per square foot is a widely used metric in the real estate industry to compare the relative value of different properties. It is calculated by dividing the total price of a property by its square footage. For example, if a 2,000 square foot house sells for $500,000, its psf would be $250.

However, the psf metric can be misleading when dealing with larger properties. This is because larger properties often have diminishing returns in terms of price per square foot. For instance, a 2,000 square foot home may be worth $250 psf, but a 4,000 square foot home on the same street may be worth $225 psf. This means that the price per square foot of the larger home is lower than that of the smaller home, even though the larger home is worth more overall.

There are several reasons why this occurs. Firstly, the cost of building additional square footage may decrease as the property gets larger, leading to a lower psf price. For example, building an additional 1,000 square feet onto a 2,000 square foot home may cost $200 psf, whereas building the same amount onto a 4,000 square foot home may only cost $150 psf.

Additionally, larger homes often have higher fixed costs, such as the cost of a pool or a large yard, which can be spread out over more square footage, leading to a lower psf price. Furthermore, larger properties may have more unique features or amenities that add value to the property, but are not reflected in the psf metric. For example, a large estate may have a tennis court or a guest house that adds significant value, but does not necessarily increase the psf price.

As a result, when analyzing real estate data, it is important to take into account the potential impact of diminishing returns on the psf metric, particularly when dealing with larger properties. This may involve using alternative metrics, such as price per acre or price per room, to compare properties of different sizes. Alternatively, analysts may need to adjust their interpretation of the psf metric to account for the impact of diminishing returns on larger properties.

In conclusion, price per square foot (PSF) can be misleading when evaluating rural properties due to varying factors such as land size, home size, amenities, and quality. In suburban and urban areas, PSF can provide greater accuracy when homes have similar lot and heated sf sizes, but it may not accurately reflect the overall value of properties with varying amenities. Moreover, the concept of diminishing returns can affect the accuracy of PSF for larger properties, where the cost of building additional square footage may decrease. Therefore, when evaluating properties, it is essential to consider various factors that can affect their value, in addition to PSF.

Here are some online resources and links that can provide further information on the topic:

  1. “Why Price Per Square Foot Is Not the Best Way to Measure a Home’s Value” by Chris Larson, The Balance: https://www.thebalance.com/why-price-per-square-foot-is-not-the-best-way-to-measure-a-home-s-value-4174472
  2. “Price per square foot: Does it matter?” by Sarah Pike, Redfin: https://www.redfin.com/blog/price-per-square-foot
  3. “The Danger of Using Price Per Square Foot to Price Your Home” by Teresa Cowart, Teresa Cowart Team: https://www.teresacowartteam.com/blog/the-danger-of-using-price-per-square-foot-to-price-your-home/
  4. “The Problem with Price Per Square Foot” by Daren Blomquist, RealtyTrac: https://www.realtytrac.com/news/home-prices-and-sales/the-problem-with-price-per-square-foot/
  5. “Why Price Per Square Foot is not a Reliable Indicator of Home Value” by Bill Gassett, Max Real Estate Exposure: https://www.maxrealestateexposure.com/why-price-per-square-foot-is-not-a-reliable-indicator-of-home-value/
  6. “How to Accurately Value a Home” by Zillow: https://www.zillow.com/sellers-guide/how-to-accurately-value-a-home/
  7. “The Truth About Price Per Square Foot” by J. Andrew English, RISMedia: https://rismedia.com/2018/11/19/truth-price-square-foot/
  8. “The Pros and Cons of Using Price Per Square Foot to Price a Home” by Bethany Johnson, Rocket Homes: https://www.rockethomes.com/blog/home-selling/price-per-square-foot


How to Avoid Being Misled by Price Per Square Foot | Discover the Limitations of Price Per SF Read More »

The Watershed Warrior

As Bill Billsbilly, patrolled his beloved watershed around his neighborhood, he knew that his enemies were always lurking nearby. Garbage trucks, with their noxious fumes and potential for littering, were his greatest foes.

So, whenever he heard the rumble of a garbage truck approaching, Bill would grab his trusty spear and don his warpaint. He would leap into action, charging towards the truck and shouting at the top of his lungs.

“Back away from my watershed, you scoundrels!” he would yell.

The garbage truck drivers would usually speed away, scared off by the wild and fierce looking man with war paint charging toward them. But if they were foolish enough to stick around, Bill was always ready to defend the watershed with all his might.

One time, a particularly stubborn garbage truck driver refused to leave, insisting that he had a job to do and couldn’t just abandon his route. Bill was having none of it. He marched right up to the truck, spear in hand, and began banging on the side with all his might.

“Get out of here, you dirty trash-mobile!” he shouted.

The driver, clearly confused and frightened by the wild man with the spear, finally relented and drove away. Bill stood like a boss, watching as the garbage truck disappeared down the road.

From that day forward, Bill became known as the ultimate defender of the watershed. People in the community would wave and cheer whenever they saw him, grateful for all the hard work he did to keep their water clean and pure despite the neighborhood smelling like pure garbage.

And whenever a garbage truck dared to drive by, they knew better than to mess with the “Watershed Warrior.”

Bill had other talents besides chasing garbage trucks, he could also pick a tune. He formed a band called the Watershed Warriors after his nickname of course. One their songs, “Manage the Land Use Dummy ,” quickly became a hit with audiences across the country.

As the band gained popularity, soon, their song hit number one on the charts, and the Watershed Warriors became a household name. The End.


WHAT IS A WATERSHED EXACTLY?


Think of a watershed like a giant bathtub that collects rainwater and snowmelt from surrounding mountains and hills. Just like in a bathtub, the water flows down to the drain, which in this case is a river or a stream.  Before it reaches the drain, the water runs over and through the ground, picking up sediment and pollutants along the way. This can include fertilizers, pesticides, and even trash from garbage trucks as Bill would have it.

That’s why it’s important to take care of watersheds. We can protect them by using natural filters like trees and plants, which can trap pollutants and reduce sediment runoff. We can also prevent soil erosion and minimize pollution from urbanization, agriculture, and other human stuff. When we protect watersheds, we not only preserve the health of our environment and the habitats of wildlife, but we also ensure that we have clean and safe water for our daily needs. Healthy watersheds can also have a positive impact on property values, as people are more likely to want to live in areas with access to clean water and natural beauty. Would you pay a premium for it?

It catches rainfall and snowmelt, then channels it into creeks, streams, and rivers, ultimately leading to a larger body of water, such as a lake or ocean even. Yes, Watersheds can vary in size greatly, ranging from small, localized areas to large regions that span multiple states or even countries. However large or small from the Mighty Mississippi to a pond on your hunting land, they are started small.

If a town is located within the boundaries of a watershed, it is possible for the watershed to supply the town with all the water it needs. This is because the water that falls within the watershed is collected and treated to make it safe for human consumption. Therefore, it’s important to protect the quality of the water within the watershed to ensure that it remains safe to drink.

A watershed encompasses all the land, vegetation, and water resources that are found within its boundaries. This includes forests, fields, wetlands, and rivers. The health of a watershed depends on the balance of all these things. Trees and plants help absorb and filter rainfall, preventing soil erosion and sedimentation of the waterways. Wetlands are like sponges, absorbing water and slowly releasing it into the surrounding environment, thereby preventing flooding downstream.

It is important to take care of watersheds because they provide many benefits to communities, including clean water for drinking, recreation, and irrigation. In addition, watersheds help support healthy ecosystems by providing habitat for wildlife and supporting biodiversity. On the other hand, degradation of a watershed can lead to erosion, pollution, and a loss of habitat, which can impact the health of the entire ecosystem.

WATERSHED VS CATCHMENT BASIN


A watershed and a catchment basin are similar in that they both refer to an area of land where all the water that falls within its boundaries flows to a common outlet, such as a lake, river, or ocean. However, a watershed is typically larger in scale than a catchment basin and encompasses all the land that drains to a common outlet, including hills, mountains, and valleys. A catchment basin, on the other hand, refers specifically to the area of land where water collects before flowing into a larger body of water.

Both watersheds and catchment basins are important because they provide a source of freshwater for drinking, irrigation, and industrial use. They also provide a habitat for various plants and animals, which in turn supports the food chain.

When PESTICIDES AND OTHER CHEMICALS these substances are applied to crops or spilled onto the ground, they can be carried by rainwater and runoff into streams and rivers, causing harm to aquatic life and making the water unsafe for drinking or recreational use.

When trees are cut down or land is paved over, there are fewer plants to absorb and filter rainwater. This can lead to increased erosion and sedimentation in streams and rivers, which can harm aquatic life and cause flooding.

DAMS IN RELATION TO WATERSHEDS


Dams can have both positive and negative impacts on the surrounding watershed. On one hand, they can provide a reliable source of water for drinking, irrigation, and other uses. On the other hand, they can disrupt the natural flow of water, affecting downstream ecosystems and wildlife.


PROPERTY VALUES IN RELATION TO WATERSHEDS


Real lie example : In the city of Atlanta, Georgia, the Chattahoochee River watershed has been a significant factor in property values.

Properties located near the Chattahoochee River, which serves as a source of drinking water for the city, are highly sought after due to the recreational opportunities and natural beauty provided by the river. According to a study conducted by the Trust for Public Land, properties located within a half-mile of the river are worth an average of 43% more than properties located farther away.

Furthermore, properties located in areas with healthy watersheds tend to be more valuable than those in areas with degraded watersheds. In the case of the Chattahoochee River, efforts to improve water quality and preserve the watershed have led to an increase in property values over time.

Overall, the health of a watershed can have a significant impact on property values in the surrounding area. As a result, protecting and preserving watersheds can have both ecological and economic benefits for communities.

As a result of the preservation efforts, the Ruffner Mountain Nature Preserve has become a popular destination for outdoor recreation and education. Additionally, the protected watershed has helped to maintain the quality of the Cahaba River’s water, which has been a selling point for nearby properties. In fact, according to a study conducted by the Trust for Public Land, the nature preserve has contributed to a $6.9 million increase in property values for homes located within a half-mile of the preserve.

Another example of how watersheds can affect property values is the Chesapeake Bay watershed in Maryland, Virginia, and Pennsylvania. The Chesapeake Bay is the largest estuary in the United States, covering an area of over 64,000 square miles, and is fed by over 150 rivers and streams. The watershed is home to over 18 million people and is a vital source of drinking water, recreation, and economic activity.

In recent years, the health of the Chesapeake Bay has been threatened by pollution from agricultural runoff, urban development, and other sources. Efforts have been made to restore the health of the Bay through initiatives such as the Chesapeake Bay Watershed Agreement, which aims to reduce pollution and restore habitat.

The health of the Chesapeake Bay and its watershed can have a significant impact on property values in the region. A study by the Chesapeake Bay Foundation found that properties located within 1,000 feet of the Bay and its tributaries had an average value that was 38% higher than similar properties located farther away. This suggests that proximity to a healthy and vibrant watershed can be a significant factor in property values. On the other hand, properties located near areas of the Bay and its tributaries that are experiencing water quality problems may see a decline in value.


Here are some online resources and links related to watersheds and property values:

“The Impact of Watershed Conditions on Property Values” – a research paper by the US Forest Service: https://www.fs.fed.us/pnw/pubs/journals/pnw_2012_kovacs001.pdf

“The Relationship between Water Quality and Property Values: A Review of the Literature” – a report by the Environmental Protection Agency: https://www.epa.gov/sites/default/files/2015-10/documents/relationship_between_water_quality_and_property_values.pdf

“Watershed Services and Property Values” – an article by the American Geosciences Institute: https://www.americangeosciences.org/critical-issues/research-database/docs/watershed-services-and-property-values

“The Value of Watersheds” – a report by the World Wildlife Fund: https://www.worldwildlife.org/publications/the-value-of-watersheds

“Watershed Property Values: A Case Study of the Jordan Lake Watershed in North Carolina” – a research paper by Duke University: https://dukespace.lib.duke.edu/dspace/handle/10161/4829

These resources provide valuable information on the relationship between watersheds and property values. They analyze the impact of watershed conditions, water quality, and other factors on property values, providing useful insights for homeowners, policymakers, and other stakeholders.

The Watershed Warrior Read More »

Methods Used by Rural Appraisers to Extract Land Value from Improvements When There Are No Recent Comparable Land Sales

Amidst the sizzling heat of a summery day in the quaint and charming town of Millville, Jake, a real estate appraiser, was tasked with the responsibility of evaluating and determining the value of two distinct properties that were scheduled to be put up for sale. The first of the two properties, 130 Crazy Horse Drive, spanned over a massive area of 20 acres, made up of a combination of flourishing, lush woodland, and verdant, green pasture. The property boasted an extensive and spacious farmhouse along with several auxiliary structures. The second property, 975 Don’t Go Down This Street, was a 15-acre property with similar characteristics and features.

Using the Sales Comparison Method to Evaluate the Properties

To start his evaluation, Jake used the Sales Comparison Method first, and it commences with the appraiser identifying properties that have been recently sold in the same market and are similar to the property being appraised. He first took the step of determining the property’s specific nature and purpose of the appraisal. Moving forward, the appraiser proceeded to define the scope of the appraisal, which entailed identifying the market area and the date of value for the appraisal. After that, he collected data on comparable sales and thoroughly analyzed and scrutinized the most relevant sales, based on various factors, such as location, physical attributes, and the date of sale. The appraiser then made adjustments to account for differences between the subject property and the comparable properties, such as size, condition, and amenities. By analyzing the adjusted sale prices, the appraiser could estimate the market value of the subject property. Finally, the appraiser reviewed the analysis and conclusions to ensure that they were based on sound data and were reasonably accurate.

The Land Extraction Method: An Alternative Approach

However, in the absence of recent comparable land sales in the immediate market area, Jake could not find enough land sales within the past several years to arrive at a supportable land value. Therefore, he resorted to using the Land Extraction Method to determine the land value. This method involves separating the land’s value from the value of any improvements on the land, such as buildings, and then arriving at a final estimate of the value of the land itself. By utilizing this method, the appraiser could evaluate the land component’s value of the subject property, even in the absence of recent comparable land sales.

Calculating the Value of Improvements

To proceed further, Jake calculated the value of the improvements on each property. After calculating the Replacement Cost New, which was estimated to be $300,000 for 130 Crazy Horse Drive and $275,000 for 975 Don’t Go Down This Street, he determined the Depreciated Value of Improvements by subtracting the estimated depreciation value of $125,000 for 130 Crazy Horse Drive and $130,000 for 975 Don’t Go Down This Street from the Replacement Cost New. Using the Depreciated Value of Improvements, Jake calculated the Site Value for each property, which amounted to $275,000 for 130 Crazy Horse Drive and $180,000 for 975 Don’t Go Down This Street.

Finally, to arrive at a final estimate of the value of each property, Jake calculated the Site Value per Acre for both the properties, which amounted to $13,750 for 130 Crazy Horse Drive and $12,000 for 975 Don’t Go Down This Street. To ensure a reasonable and accurate appraisal, Jake made the requisite adjustments based on various factors such as location, zoning, and accessibility. However, he was unaware of the numerous other crucial factors that he had to take into consideration before finalizing his appraisal, which could have potentially altered the final evaluation of each property.

Additional Methods

A few additional methods that appraisers use to determine land value in a property with improvements include the Land Residual Method and the Development Method. The Land Residual Method involves subtracting the value of the improvements from the total property value to determine the land value, which is useful when there are no recent land sales to compare. The Development Method estimates the potential profit that could be earned by a developer from developing the land, considering factors like zoning regulations and potential revenue. By utilizing these methods in conjunction with others, appraisers can obtain an accurate evaluation of the subject property’s land value, especially in rural areas where comparable land sales may be scarce. Another method that appraisers may use is the land-to-building ratio method, which involves comparing the land value to the building value of similar properties and applying that ratio to the subject property. The land-to-building ratio method, also known as the Allocation Method, is another technique used by appraisers to find the land value in a property with improvements. This method involves comparing the ratio of land value to building value for similar properties in the market area, and then applying that ratio to the subject property to estimate the land value. By using this method, appraisers can arrive at a reliable land value estimate even in the absence of recent land sales or in cases where other methods are not applicable.

It’s worth noting that when using any of these methods to determine land value in a property with improvements, appraisers must consider various factors that may affect the land’s value. These factors may include soil quality, topography, frontage, and other characteristics that may affect the property’s potential use and market demand. By taking these factors into account and employing multiple techniques, appraisers can ensure a comprehensive evaluation that accurately reflects the value of the subject property.

Conclusion

Overall, determining the value of land with improvements can be a complex process, particularly in rural areas where there are no recent comparable land sales. However, with the right expertise and tools, appraisers can arrive at a reasonable and accurate appraisal of the land value. By employing the Land Residual Method, the Development Method, the Allocation Method, and other techniques, appraisers can ensure that the appraisal considers various factors that may impact the land value.

Methods Used by Rural Appraisers to Extract Land Value from Improvements When There Are No Recent Comparable Land Sales Read More »

Exploring the Difference Between Excess and Surplus Land

As a real estate professional, I have come across many properties that have additional land that is not necessary to support the existing improvement. This additional land is either considered as Excess Land or Surplus Land, and understanding the difference between these two scenarios is crucial when it comes to determining the value of a property.

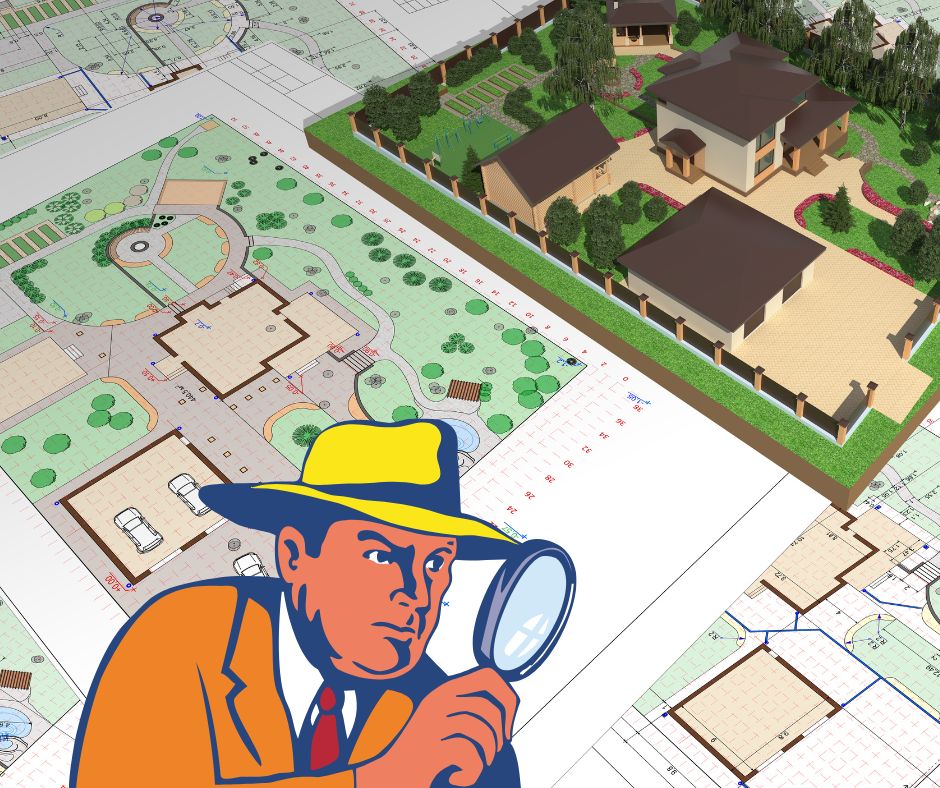
Excess Land is land that is not necessary to serve or support the existing improvement but has a different highest and best use and can be separated and sold off. For instance, imagine a property with a main parcel and a vacant parcel adjacent to it with easy road access. This vacant parcel is considered as Excess Land as it has a different highest and best use and can be sold off separately. The additional land has the potential to contribute to the overall value of the property.

On the other hand, Surplus Land is not necessary to serve or support the existing improvement, but it cannot be separated and sold off. Unlike Excess Land, it does not have a different highest and best use and may or may not contribute to the value of the overall parcel. An example of this would be a home situated on a larger than typical parcel with no direct access other than traveling over the main parcel.

When appraising a property, it is important to consider the highest and best use of the parcel as if it were vacant. This involves applying the highest and best use test, which considers whether the land is legally permissible, physically possible, financially feasible, and maximally productive. Based on the results of this test, the additional land can be determined to be either Excess Land or Surplus Land.


Excess Land typically contributes more value to the property as it has a different highest and best use and can be sold off, while surplus land does not have a separate value a

and may or may not contribute to the overall property. Additionally, it is important to consider the zoning regulations and deed restrictions when dealing with additional land, as they will play a role in determining the value of the property.

The photograph on the left is a clear demonstration of the differences between two pieces of land. One is narrow and lacking road frontage, while the other is expansive with ample frontage. This contrast highlights the important factors that must be considered when evaluating a piece of property.

It is important to note that this is just one example of the differences between excess and surplus land. The shape and frontage of a parcel can greatly impact its potential for development and overall value. It is up to the wise property owner to consider all aspects of a piece of land, not just its size, before making a decision.

When evaluating a potential piece of property, take a closer look at its shape and frontage. Consider its potential for supporting other developments and weigh the opportunities it presents. Remember, the value of a piece of land is not just in its size, but in its shape, frontage, and ability to support other developments.

Understanding the difference between Excess Land and Surplus Land is crucial for real estate professionals, as it will help them in determining the value of a property and providing the best advice to their clients.

Exploring the Difference Between Excess and Surplus Land Read More »