Steven Sparks | Backwoods Land Co.

Powered By EmbedPress

This 294 acre tract in Alcorn County, MS is a turnkey hunting and timber tract. Located just 3 miles from the Tuscumbia River, this tract benefits from its proximity to the surrounding wetlands, which are known to be a key stopover along the Mississippi Flyway. While primarily suited for deer hunting, the fertile creek bottoms in the low lying wetland areas of the property may also create suitable conditions for attracting waterfowl during migration seasons. Walnut is also well known from prime turkey hunting. The combination of varied terrain and water access enhances the tracts hunting versatility.
The natural ridges, valleys, and gentle slopes create ideal movement corridors for deer. These natural features form good pinch points, while multiple cleared areas would make ideal food plots. A 672 sq. ft. manufactured home, featuring 2 bedrooms and 1 bathroom, serves as a convenient hunting camp with power and water. Additionally, power and water and fiber are available at the road (County Road 762), with multiple prime spots along the road.
In addition, this tract features a rich stand of bottomland hardwoods, shortleaf, and loblolly pines. The combination of wildlife and timber make this property valuable in more ways than one.
Conveniently located within easy driving distance to Ripley (18 miles), Corinth (30 miles), Tupelo (50 miles), and Memphis (70 miles), this property offers the perfect blend of outdoor recreation and accessibility.
 
🦌 Prime deer and turkey hunting
🦆 Potential waterfowl opportunities due to lowlying wetland bottoms portion and proximity the Mississippi Flyway
🌲 Rich timber resources: bottomland hardwoods, shortleaf, and loblolly pines
🏠 672 sq. ft. hunting camp with power and water
🔌 Utilities (power, water, fiber) available at the road
📍 Multiple building sites
🏫 Located in the Alcorn County School District
🚗 Easy access to Ripley, Corinth and Tupelo
 
☎️ Steven Sparks 662-523-4503
☎️ Office: 601-209-4882
Facebook
Twitter
LinkedIn

Powered By EmbedPress

Uncategorized

Pontotoc County Mississippi Soil Types and History


Pontotoc County Soil Types and History


In the northern part of Mississippi, Pontotoc County is a place bursting with geological history and agricultural potential. The soils here, shaped over millions of years, give us a fascinating peek into the past and provide a rich foundation for the future.

Here are a few soil types in Pontotoc County Mississipi

Loam and Clay Soils


Uses: Highly fertile, perfect for farming. Ideal for crops like cotton, soybeans, corn, and sweet potatoes.
Proportion: 25%
Sandy Soils
Uses: Great for construction because they drain well and provide a solid foundation.
Proportion: 20%
Silty Soils
Uses: Easy to work with and excellent for farming due to their ability to hold nutrients and water.
Proportion: 20%
Bentonite Clay
Uses: Holds water well and provides essential minerals, beneficial for farming and conservation efforts.
Proportion: 15%
Timber Soils
Uses: Ideal for growing timber, supporting the growth of hardwood and pine trees.
Proportion: 20%
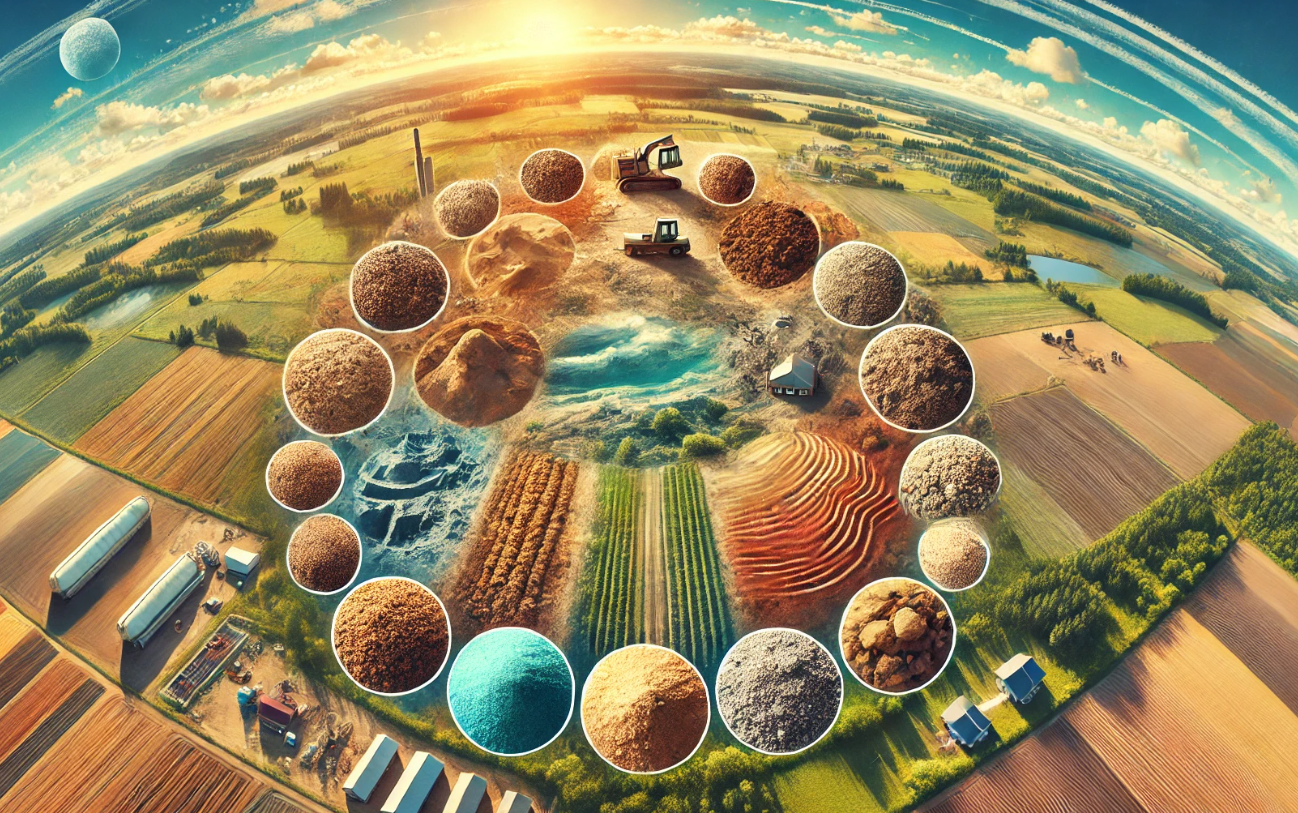
Here’s a detailed view of the different soil types and their uses in Pontotoc County:

The Geological Backbone


The soils in Pontotoc County are part of the Ripley Formation, which dates back to the Late Cretaceous period, about 70 to 100 million years ago. This formation includes layers of sand, silt, and clay. Among these layers, scientists have found bentonite clay, which comes from ancient volcanic ash. This clay helps us understand old volcanic activities and climate conditions. (This means we can learn about ancient volcanoes and what the environment was like millions of years ago.)

Composition and Formation


The Ripley Formation is a significant geological structure within the Gulf Coastal Plain, stretching across several states in the southeastern U.S. It’s mainly made up of marine sediments from when the area was covered by a shallow sea. These sediments turned into rock over time.

Sand: These layers are fine to medium-grained with ripple marks and cross-bedding, showing they were deposited in an active environment with currents and waves. (This tells us the sands were moved and shaped by water long ago.)
Silt: Finer than sand, silt settled in quieter waters like lagoons or deeper parts of the ancient sea, indicating calmer periods. (This means the silt settled in calmer waters.)
Clay: Particularly important because it contains bentonite from volcanic ash, this clay records volcanic activity and its impact on the climate. Bentonite is also valuable for its high water absorption and swelling properties. (This means the bentonite clay tells us about past volcanoes and is useful today.)
Volcanic Ash and Bentonite Clay
Bentonite clay formed from volcanic ash that settled millions of years ago. This ash, from distant volcanic eruptions, was carried by wind and water to the area. Studying bentonite gives us several insights:

Volcanic Activity: Bentonite layers show periods of significant volcanic activity. (We can learn how often and how big ancient volcanoes were.)
Climatic Conditions: Volcanic eruptions affect the climate by blocking sunlight and cooling the Earth, and studying ash layers helps reconstruct past climate conditions.
Sediment Transport: By studying minerals like zircon in the bentonite, geologists can trace the origins and paths of these sediments. (We can understand where the sediments came from and how they moved.)

Research and Applications


Research on the Ripley Formation, like the work by Elizabeth Jayne Vitale, helps us understand the origins and transport pathways of sediments, helping piece together the region’s geological history. These  studies help us understand geological processes and the connections between different regions.

Bentonite clay is not just scientifically significant but also useful in various industries. Its high water absorption makes it great for drilling mud in oil and gas exploration, binding foundry sands, and making cat litter. It’s also used in environmental applications like landfill liners due to its ability to absorb contaminants.

Agricultural Significance


The soils of Pontotoc County are the backbone of the local agricultural community. The region’s soil, enriched with minerals from its geological past, supports a variety of crops. The fertile loam and clay soils are ideal for growing cotton, soybeans, corn, and sweet potatoes. Bentonite layers improve soil health by retaining water and providing essential minerals that help plants grow.

Farmers benefit from the natural fertility of these soils, reducing the need for artificial fertilizers and promoting sustainable farming practices. The county’s agricultural output supports the local economy and contributes significantly to Mississippi’s overall agricultural productivity. (Farmers can grow more crops naturally, helping the economy and the environment.)

Suitability of Soils


Different soil types in Pontotoc County are suitable for various uses:

Loam and Clay Soils: Highly fertile, perfect for farming. These soils are great for crops like cotton, soybeans, corn, and sweet potatoes. (These soils are very good for growing crops.)
Sandy Soils: Great for construction because they drain well and provide a solid foundation. These soils are less fertile for crops but excellent for building structures. (These soils are good for building because they don’t hold water.)
Silty Soils: Easy to work with and excellent for farming due to their ability to hold nutrients and water. (These soils are great for growing a variety of plants.)
Bentonite Clay: Holds water well and provides essential minerals, beneficial for farming and conservation efforts. (This clay helps improve soil health and is useful for various environmental purposes.)
Timber Soils: Soils with a good mix of sand, silt, and clay, often found in well-drained upland areas, are ideal for growing timber. These soils support the growth of hardwood and pine trees, making them suitable for the timber industry. For building and construction, stable, well-drained sandy and loamy soils are preferred as they provide a solid foundation and reduce water retention issues.

Environmental and Conservation Efforts


Understanding the geological and agricultural aspects of Pontotoc County’s soils is crucial for environmental conservation. Soil erosion, degradation, and nutrient loss are challenges that can affect the land’s long-term viability. By studying the soil, scientists and farmers can develop better management practices.

A Glimpse into the Past, a Resource for the Future


The soils of Pontotoc County are a testament to the region’s rich geological history and agricultural potential. From ancient volcanic ash to fertile fields, these soils are both a window into the past and a resource for the future.

Contact Form

Pontotoc County Mississippi Soil Types and History Read More »

Land for Sale | Ball Rd, Ecru Mississippi

Powered By EmbedPress

Contact Form

Land for Sale | Ball Rd, Ecru Mississippi Read More »

North MS Quarterly Land Analysis

Land Market Analysis in North Mississippi within the Past 12 Months Influence of Areas on Property Types


The following land analysis will be broken down in areas from 80-120 acres in the North Mississippi area. Areas A-1 being most desirable, areas C-3 being least desirable. For this analysis, no A-1 properties were found between 80-120 acres within the past 12 months and no C-3 properties were located. Keep in mind, the more land, the lower per acre due to diminished returns.

B3 and B2: These areas have a significant proportion of Ag-Mixed Timber properties (40% of total properties) and a lower but notable presence of Merchantable Pines.

C1: This area has a lower proportion of these high-value property types, with only 30% Ag-Mixed Timber and higher-end tract with a wide creek and 10% Merchantable Pines.

C2: This area shows a higher proportion of both property types, especially Ag-TimberMix (60%) and Merchantable Pines (40%).

The following is a breakdown of land types:
  • Mixed Timber: 21.4%
  • Ag-Mixed Timber: 17.9%
  • Merchantable Pines: 10.7%
  • Ag-Watershed: 3.6%
  • Ag-Natural Pines: 3.6%
  • PlantedPines-Hardwoods: 3.6%
  • Mixed Timber-Thinned: 3.6%
  • Ag-RowCrop-TimberMix: 3.6%
  • PlantedPines-Cutover: 3.6%
  • Mixed Timber Cutover: 3.6%
  • Natural Pines: 3.6%
  • Ag: 3.6%

This chart depicts a broader variety of land types and their respective proportions. The largest segments are “Mixed Timber” (21.4%) and “Ag-Mixed Timber” (17.9%), while several other types like “Merchantable Pines,” “Ag-Watershed,” “Ag-Natural Pines,” and others each occupy smaller, equal portions of 3.6% or 10.7%.


Impact on Average Prices:

The presence of high-value property types like Ag-TimberMix and Merchantable Pines positively influences the average price per acre in these areas.

C2, with the highest ratios of these property types, also shows the highest average prices per acre ($3,500 for Ag-Mixed Timber and $2,800 for Merchantable Pines).

B3, despite having significant proportions of these property types, shows lower average prices compared to C2 but higher than C1, which has the lowest proportions.

Influence of Areas on Property Types:

A2, A3, B1: These areas have significant proportions of Ag-TimberMix and Merchantable Pines, which influences their higher land values.

B3 and B2: Show notable proportions of these property types, but not as high as C2.

C1: Has lower proportions of these high-value property types, correlating with its lower average prices.

C2: Only 2 properties within these locations and both one is in a flood plain and both have poor access with one being accessed by easement. This was the lowest land class price per acre of $1,600. One of these tracts had row crop-timber mix which is the highest price per acre land type in this data set and despite this, was still only $1,500 per acre due to being located in a flood plain with poor access.

Impact on Average Prices

Areas with higher proportions of Merchantable Pines and Ag-TimberMix generally have higher average prices per acre.

Examining how long properties stay on the market in different areas

Area A2: Generally sells within 30-40 days

Area B3: Takes around 50-60 days to sell

Area C1: Longer market duration, around 70-80 days

Interpretation: Areas like A2 with quicker sales indicate higher demand, while areas like C1 with longer market durations suggest lower demand or more challenging sales conditions. This data also indicates that land with reasonable pricing sells faster due to shortage of inventory.
Trend of Days on Market vs. Sold Date by Property Type

Analyzing how quickly different property types sell:

Residential Development: Sells within 30-40 days

Cutover Land: Takes around 60-70 days to sell

Interpretation: Property types like Residential Development are in higher demand and sell quicker, while Cutover land takes longer to sell due to additional development requirements.
Trend of Days on Market for Cutover Properties

Specifically for cutover properties:

Cutover Land: Consistently takes 60-70 days to sell

Interpretation: The longer days on market for cutover properties reflect the challenges in selling this type of land, likely due to the need for clearing and development.
Trend of Days on Market for Floodplain Properties

Analyzing the market duration for floodplain properties:

Floodplain Properties: Generally took 80-90 days to sell

Area Classification: The strongest correlation found in the data is with area classification. Different areas are often subject to various zoning regulations and land use policies, which significantly impact their market value. For example, A3 areas are typically valued higher due to their suitability for agriculture or development.
Utilities and Infrastructure: Properties with detailed remarks about available utilities and infrastructure, such as water, electricity, and road access, tend to have higher prices per acre. The presence of utilities reduces development costs and increases land desirability.


Average Price per Acre by Area

Land prices vary widely across different areas. Here’s a breakdown of the average prices per acre:

Area A2: $3,800 per acre

Area B3: $3,600 per acre

Area C1: $2,000 per acre

Interpretation: Areas with better infrastructure, accessibility, and development potential (like Area A2 and B3) have higher land values. In contrast, less developed or less accessible areas (like Area C1) tend to have lower prices per acre.


Average Price per Acre by Floodplain Status

Understanding the impact of floodplain status on land value:

Non-Floodplain: $3,200 per acre

Floodplain: $2,400 per acre

Floodplain areas were generally located in Ag-Mixed timber areas

Average Price per Acre by Status

Analyzing land prices based on market status:

Active Listings: $3,200 per acre

Closed Sales: $2,800 per acre

A-1 – B1 properties have a higher disparity compared to tracts in less desirable locations.

Active Listings: $3,500 per acre

Closed Sales: $2,800 per acre

B-2 – C-2 Tracts

Active Listings: $2,000 per acre

Closed Sales: $1,600 per acre

There are several variables that have influence over these property groups, however, there is a clear correlation between area and value. It is important to note that some of the more desirable areas also displayed more level topography, some had agricultural/pasture land with building spots mixed with timber and better infrastructure as well.


Contract vs. Sold Price Analysis

To understand market trends a little better, we compare the contract price and sold price for closed sales:

B-3 through C-3:

These areas generally have a mix of land types but often show significant proportions of less developed or less agriculturally productive lands.

Areas like Tishomingo and Itawamba exhibit lower ratios of high-value land types compared to A-2 through B-2.

A-2 through B-2:

These areas often feature better topography suitable for agriculture, such as Ag-Mixed Timber properties and other high-value land types.

Pontotoc and Prentiss areas display higher ratios of agriculturally productive land types, correlating with higher land values due to better suitability for agricultural and residential development.

Topography and Price Correlation

Better Topography in A-2 through B-2: These areas are more likely to have better topography, making them more suitable for agriculture and residential development. This suitability is reflected in higher average prices per acre.

Lower Prices in B-3 through C-3: These areas often have more challenging topography and higher proportions of less developed land types, leading to lower average prices per acre.

For more see my twitter page below. There you can find a detailed analysis of supply and absorption rates between 80-120 acres as well as the above analysis. Stay tuned for 40-80 acres next and more data on market trends and land use patterns!

North MS Quarterly Land Analysis Read More »

Don’t Settle for Less | Importance of Land Sale Exposure

From Quiet Corner to Market Square: Maximizing Your Land Sale Potential

Consider your land as an item on a store display. Opting for sale by owner is akin to setting up a small stall in a quiet corner – you might get a couple of interested passersby, but your reach is limited. However, with a land agent or broker, it’s like having a bustling market square at your disposal. We utilize our networks, targeted marketing, and industry connections to create a buzz around your land, attracting a wide range of potential buyers. How do you know what it’s really worth unless it’s exposed to the maximum amount of potential buyers?

Many will say, a thing is worth what someone will pay for it and that sounds reasonable – on the surface. But market value goes beyond a single offer or 2 or 3 if the property isn’t exposed to the market. Generally, market value is defined as the most probable price that a property should bring in a competitive and open market under all conditions requisite to a fair sale, the buyer and seller, each acting prudently, knowledgeably and assuming the price is not affected by undue stimulus. One caveat is that a reasonable time is allowed for exposure in the open market. “Exposure in the open market” being key here.

For Sale by Owner Listings Often Leave Money on the Table

While an FSBO listing might technically meet the “reasonable time” requirement, the limited reach often translates to a smaller pool of buyers. This can lead to a final sale price that falls short of true market value. A land broker, on the other hand, can significantly increase your exposure through various channels, attracting a much wider group of buyers who are actively seeking land including local and out of state buyers. This open market competition is what truly reveals the market value of your land, ensuring you get the best possible price. Maximizing exposure can help create competition among buyers, ultimately maximizing the sale price of your land.

Therefore, working with a professional such as Backwoods Land Company who can facilitate broad exposure in the open market is by far the best way to achieve the true market value of your property. By partnering with us, you can rest assured that your land is seen by the right buyers, leading to a competitive bidding process that delivers the best possible outcome.

☎️ Steven Sparks 662-523-4503
☎️ Office: 601-209-4882

Don’t Settle for Less | Importance of Land Sale Exposure Read More »

Beyond the Tangible: Different Layers of Opportunity Costs


                                        It Ain’t Always about the Benjamins
 

Opportunity cost is a concept deeply rooted in economics, but it touches every facet of our decision-making, both in business and our personal lives. At its core, opportunity cost represents the potential benefit that one misses out on when choosing one alternative over another. It’s not just businesses that benefit from understanding opportunity costs. On a personal level, it’s about realizing that resources, especially time and money, are limited. Every choice we make, consciously or not, involves a trade-off. For example, choosing to live in a bustling city might mean easier access to amenities, job opportunities, and a vibrant social scene. However, it also represents the tranquility, space, and potentially lower living costs one might have enjoyed in a more rural setting. Deciding to take a stable, well-paying corporate job right after graduation might bring financial security and a structured career ladder. Yet, the opportunity cost could be the innovation, diverse tasks, and potential for rapid growth one might find in a startup environment, even if it comes with more risk and uncertainty.


Breaking Down the Concept in Terms of Business and Money


Imagine you have $100. You could either invest it in a business opportunity promising a 10% return or spend it on a new pair of shoes. If you choose the shoes, the opportunity cost is the potential $10 return you would have gotten from the investment. In the business world, understanding opportunity costs is essential for strategy, resource allocation, and prioritization. Before any investment, be it in new equipment, hiring, or R&D, companies often analyze what they might be missing out on. This helps them ensure that their resources are channeled in the direction promising the highest returns. However, this is for business decisions. We are focusing on both business and personal opportunity costs however.

Making Better Decisions

Awareness of opportunity costs can lead to more informed and thoughtful decisions. Here’s how:

List Alternatives: Before making a choice, list down all the viable alternatives. This gives you a clear picture of your options.

Evaluate Potential Benefits: Consider the potential benefits of each option. What will you gain from each choice, both short and long term?

Consider Non-Monetary Factors: Intangibles, like happiness, health, and knowledge, are equally so important.

Stay Updated: The value of alternatives can change. Periodically review your decisions and adapt as necessary.

Accept Imperfection: Sometimes, hindsight will reveal imperfect decisions. Learn from them and move on.

Emotional Well-being and Peace of Mind

Decisions impact our mental and emotional states. Choosing a high-paying job with long hours over a more flexible one might increase stress, reducing time with family and impacting mental well-being.

Learning Experiences and Growth: Opportunity costs also encompass personal growth. Turning down an internship to travel might open doors to unforeseen opportunities or personal insights that professional experiences wouldn’t provide.

Networks and Relationships: In today’s interconnected world, the relationships we foster can be invaluable assets. Choosing to attend a networking event might lead to a partnership, mentorship, or a lifelong friendship.

Legacy and Long-term Impact: Think about the lasting impact of your choices. Choosing a job that aligns with one’s values can lead to a sense of purpose and fulfillment that monetary gains can’t provide.

Conclusion


Opportunity cost definitely extends beyond the tangible. While clear financial or time-related trade-offs are prevalent, the intangibles—those elements that don’t neatly fit into spreadsheets—hold incredible value. This becomes especially clear when we consider the relentless pursuit of monetary gain. In our drive for more, whether it’s a larger paycheck, a grander house, or a fancier car, we often neglect the deeper, intangible rewards that life can offer, such as peace of mind, meaningful relationships, personal growth, and a sense of purpose.

It’s important to remember that there’s always someone who will outpace you in the money game. No matter how hard you work or how much you earn, there will always be someone earning more, or boasting a more impressive title. And while financial stability and comfort are important, making them the sole focus of one’s life can lead to a never-ending cycle of competition and comparison. This game is essentially unwinnable, and the constant chase can make one’s journey miserable full of dissatisfaction and unrest.

It’s a sobering thought, but it’s also liberating. Once we acknowledge the limitations of monetary pursuits, we can shift our focus to other areas of life that offer richer, more enduring rewards. By understanding and respecting the trade-offs inherent in every decision, especially the intangible ones, we position ourselves for a more balanced, fulfilling life 

Facebook
Twitter
LinkedIn

Beyond the Tangible: Different Layers of Opportunity Costs Read More »

Ravin Crossbows

Check out these Bad Boys!! Click Box Below on Left to Order!

Previous slide
Next slide

Experts Pick Ravin’s Best Crossbows

We recently reached out to a handful of professionals who hunt — and write about hunting — for a living. Over the years, we’ve sent these writers the latest and greatest crossbows for tests and reviews … now we’re asking which Ravin crossbows are their favorites and why.

R29X

Selected as their favorite by both Will Brantley (writer & editor of Field & Stream Hunting GuidePetersen’s Hunting, and Realtree) and Nancy Jo Adams (Owner of Life in Camo Media, Popular Mechanics Outdoor Gear Expert and writer for Field and Stream), the Ravin R29X got the highest marks for its near-perfect blend of speed, power, accuracy, and maneuverability.

Will calls the R29X’s cocking mechanism “nearly silent” and Nancy Jo appreciates how easy it is to use the R29X in a ladder stand — even one-handed! Carrying it around on long stalks, aiming for an extended time freehanded, cocking and uncocking all were accomplished without strain or struggle. Nancy Jo particularly recommends the R29X for women and smaller-framed hunters. 

For Will, it’s all about the accuracy. He calls it one of the most accurate bows he’s ever tested, praising the Ravin 100-yard illuminated scope that comes as part of the package. Will says, “Crossbow scopes have inherently busy reticles, so you need marks that are easy to read in low light and under pressure.”

Nancy Jo uses her R29X with a Ravin Soft Case and Arrow Case. “For getting from the lodge to my hunting area by UTV, I always keep my crossbow in the soft case,” she says, “Not only to protect it from being knocked around but also to keep excessive dust that the tires kick up off of the components of my crossbow.” The Soft Case provides extra storage in two long zippered pockets along the top and has handles and a backpack-style shoulder system. Having a secure place to store your crossbow is vital to the longevity and performance of your crossbow.

Ravin Crossbows Read More »

REAL ESTATE CRASH IN 2023 OR JUST A MORE STABLE MARKET?


I am often asked whether or not the market is crashing. I would answer yes, the market is crashing, well….sort of. New listings are crashing (usually happens this time of year), but so are marketing times. Sales are down but list to sales price is up.  What does this mean? It means there is STILL shortage of inventory. Why you ask? It is possible that the high level of home buying activity in the past year may have temporarily reduced the pool of potential buyers AND sellers. Also, so many refinanced at such low rates during the covid pandemic, it would be hard to think that many would make a move in the foreseeable future. Low mortgage rates can make it more affordable for homeowners to stay in their current homes and can reduce the incentive to sell and move to a new home.


2008 vs 2023


The most striking contrast between the present recession and that of 2008 is the state of housing credit. In 2008, the foreclosures and bankruptcies that arose served as a warning of the impending job loss recession. However, today’s story is vastly different. Loose lending, adjustable-rate mortgages which led to sudden high monthly payments, and 0 money down loans are not the major factor when the economy went belly up in 2008. Homeowner equity is at the highest level it’s been in the past several decades as well. Credit scores are areoverall up over the past 12 years. Hale expects U.S. home prices to rise by 5.4% this year, while Morgan Stanley is forecasting a 7% drop from the peak in June 2022.
Still, many economists agree that a housing market crash like the one we experienced in 2008 is highly unlikely. The factors that caused home prices to plunge during the Great Recession—specifically lax lending standards and a surplus of inventory—aren’t prevalent in our current market.10 Therefore, home values are expected to remain comparatively stable.

‘Are the foreclosures here yet?’ ‘When do you think we begin to see foreclosures hitting the market?’

It is difficult to predict exactly how it will evolve over time because the housing market is influenced by many factors and can change rapidly, however, at the present time, it appears there are a pool of buyers in every property value segment that are willing to pay more than they did even 3 months ago. The market has been slowly increasing in terms of value, but sharply decreasing inventory. Note that in the following charts, there are some small changes that may signify the market pulling in a different direction but also not it is January and is those changes are typically normal for the 1st quarter.

If you’ve been frustrated by a lack of inventory in the past, later 2023 may bring new opportunities for you to find the perfect home. And today’s buyers have more negotiating power than they’ve had in years. Call us today @ (662) 523-4603 for a consultation!

Let’s start with sales prices of $700,000 to $1,000,000. It is clear that overall price per sf in the segment is increasing despite low inventory. Days on market is decreasing, list to sales price ratio slightly increasing.


Slight uptick in list to sales price ratio


$500,000 to $700,000 Range

Price Per Sf slightly up


Median price somewhat steady

Listings down, sale absorption rate up

List to sales price ratio slightly down. Although fewer sales, there is a lack of Inventory in this price range putting upward pressure on sales prices


$325,000 to $500,000

Small Decrease in Exposure Time on the Market


$230,000 to $350,000


Again, similar to the other housing supply segments

Significantly more sales than listings with past several months


$185,000 to $235,000


Although a decreasing housing supply, within this price range, it is has been less significant until recently as shown below


A slight but steady increase in price per SF


$95,000 to $185,000


Sharp decrease in housing supply within the past 3 months


$50,000 to $95,000


$30,000 to $50,000 – Cash Dominated Sales

As demonstrated, all of these market price segments have several common undeniable trends. Low and decreasing housing inventory, increasing list to sales price ratio, decreasing days on market, increasing price per sf and sales prices. Although, there are many more factors to consider in appraisal, this overall macro value show significant enough trends in each market segment to determine that we are still in Northeast Mississippi are in the midst of a housing shortage with a pool ready buyer. However, finding willing sellers is the current challenge facing the market in 2023.

This should all help with builders in the near future and evidently is now as shown below. We should also an increase in multifamily starts.


Of some interest, in the above chart that average per sf of foreclosed homes in the area has been trending downward.


In conclusion, listings are crashing but the prices are not due to a pool of willing buyers with few sellers willing to sell. Time will tell whether this changes, but there are no significant statistical signs showing it will in the near future. In my opinion, the market will eventually reach a state that is more in an equilibrium in 2023.

Call us today @ (662) 523-4603 for a consultation!


REAL ESTATE CRASH IN 2023 OR JUST A MORE STABLE MARKET? Read More »